Introduction
There is a large variety of variables that users can explore with the Teen Safety Heat Map. This tutorial demonstrates a walkthrough of how to identify and analyze the biggest problem areas for teenagers driving under the influence of alcohol from 2011-2015. Please refer to the Teen Heat Map user guide if you are not familiar with the application; it will explain the various features available.
1. Overview
The tutorial will cover how to:
- Select filters for query
- Adjust the year ranges
- View data summary
- Download crashes
- View county summary
- Find most severe zip codes
- View zip code summary
Parameters for Query
- Heatmap Variable: HBD (Has been Drinking) Driver Age < 21
- Divisor Variable: Population (100k)
- Year Range: 2011-2015
2. Guide
The following section will guide you through the process step-by-step.
1) Open up the Teen Heatmap tool
From the main TIMS menu go to the Tools dropdown menu and select Teen Safety Heat Map.
2) Select the Filters
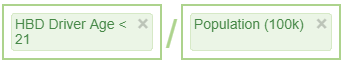 Drag HBD Driver Age < 21 into the first box and Population (100k) into the second.
Note: HBD stands for Has Been Drinking.
3) Adjust Year Ranges
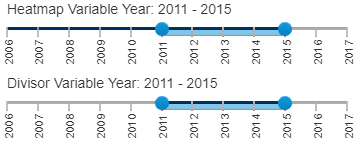 We want the year range to be from 2011 to 2015, so adjust the year sliders to reflect that. Then, click Show Results.
4) View Data Summary
Now, let's click Data Summary and see which counties suffered most from underage drinking and driving. To order the counties in the table by the highest average ratio, or most number of injured/killed HBD drivers under age 21 per 100,000 people, click on Rate once in the table header. Although Trinity appears to be the biggest problem area, the data is skewed by the small sample size, and there were 0 teens injured/killed in 2013 and 2015. Instead, we will analyze Shasta, which has a high ratio and a bigger sample size.
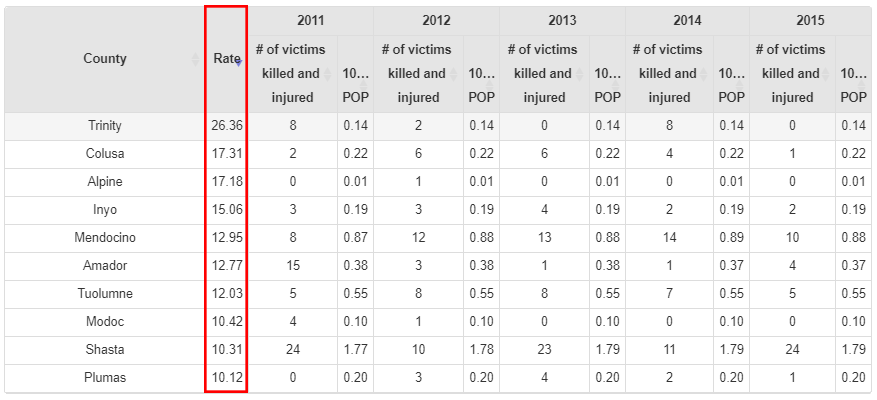
Note: You cannot click on Data Summary unless you have clicked Show Results first.
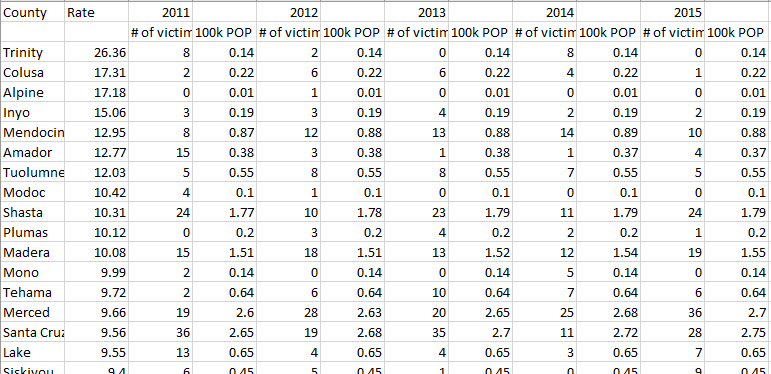
5) Download Crashes
Download the crashes as a .csv file for future reference/use. It should look like this:
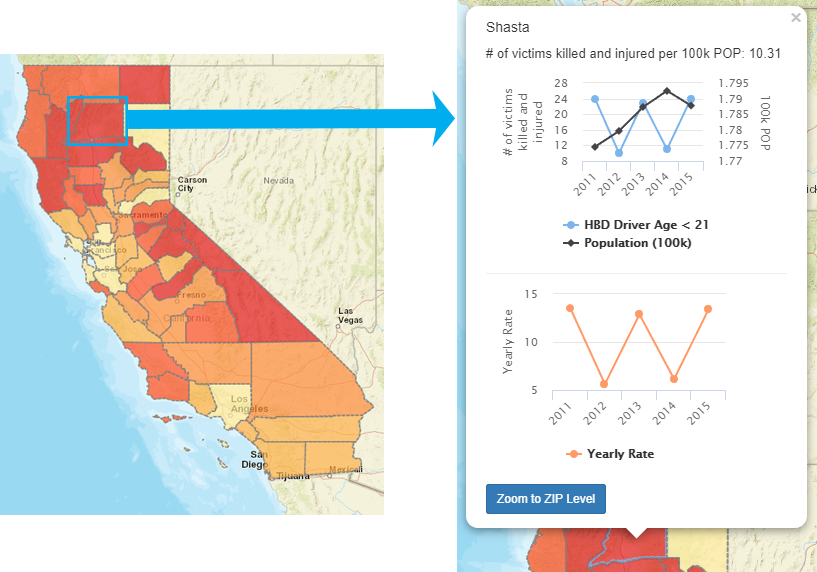
6) View County Summary
Let's take a look at Shasta's summary statistics by clicking on the county in the map. The Yearly Rate graph shows that the number of teens killed/injured per 100,000 people fluctuated each year.
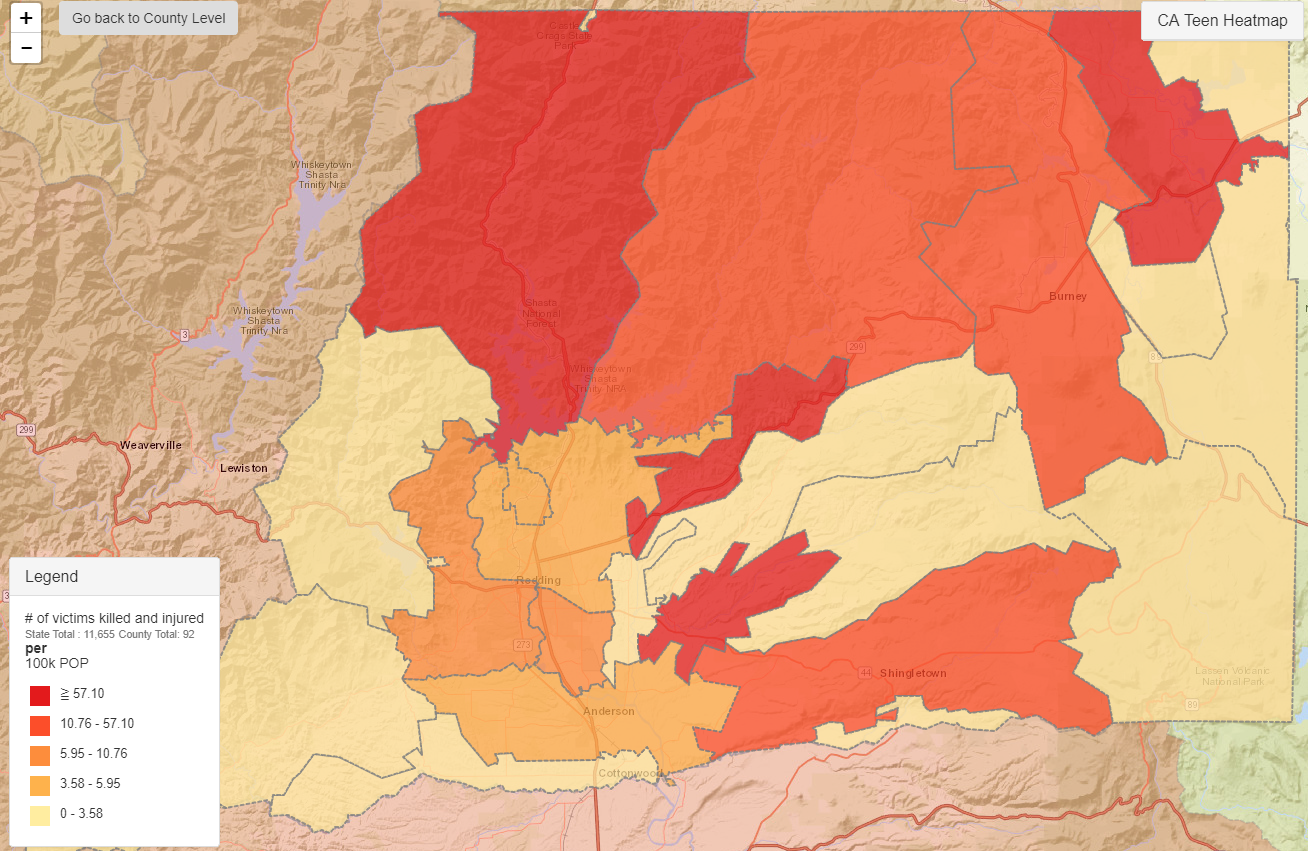
7) Find Most Severe Zip Codes
Now, let's click on Zoom to ZIP Level and dive into the zip codes within Shasta. Areas with darker shades of red have higher rates and are more severe. According to the map and legend, crashes related to underage drinking and driving are most serious in 4 zip code areas within Shasta. We will inspect the bottom-most one.
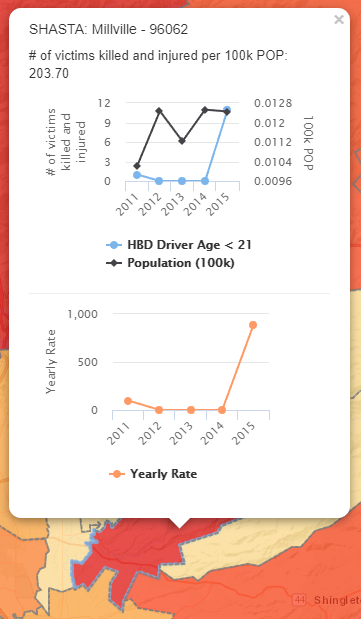
8) View Zip Code Summary
Click on the bottom-most dark red area. Looking at the summary, we can see that Millville - 96062 had an average rate of 203.7! Although this rate is skewed by the 2015 data, the graphs still show a significant spike in victims killed and injured per 100,000 people from 2014 to 2015, which probably should be addressed.
Tip: Take a screenshot of this summary. This may be helpful as a reference to remember which zip code is a problem area and needs to be addressed.
3. Wrap Up
Hopefully, this tutorial has increased your familiarity with both the tool and the countless numbers of tasks that can be achieved with it.