Introduction
Alcohol- and drug-related crashes continue to contribute significantly to traffic deaths and injuries in California. This tool allows users to explore alcohol- and drug-related crash and injury trends, both statewide and in a county or city area.
To use this tool, click on DUI Crash Summary and Map Tool from the Tools dropdown menu.
How to Use the Tool
The tool is divided into two sections.
- Three charts show statewide trends from 1997 to current.
- An interactive map of California by county allows users to select their variables and years of interest. The map and following charts update based on the variables that a user selects.
Definitions
The data used for the tool comes from the Statewide Integrated Traffic Records System (SWITRS). Due to differences in variables and definitions, figures below may differ from those in the nationwide Fatality Analysis Reporting System (FARS). When looking at combined alcohol- and drug-related data, the term DUI (Driving Under the Influence) is used for brevity, as is the term FSI for combined fatalities and serious injuries. See the bottom of the page for detailed definitions of alcohol-related and drug-related crashes.
Data used for this tool
- Alcohol-involved crashes are injury crashes where the involved driver(s),
PARTY_TYPE=1, had been drinking. The state of sobriety of the party (PARTY_SOBRIETY) includes "B - Had Been Drinking, Under Influence", "C - Had Been Drinking, Not Under Influence", and "D - Had Been Drinking, Impairment Unknown". - Drug-involved crashes are injury crashes where the involved driver(s),
PARTY_TYPE=1, were under drug influence. The state of the party with regard to drugs and physical condition (PARTY_DRUG_PHYSICAL) includes "E - Under Drug Influence". - DUI crashes are injury crashes where the involved driver(s) were designated as having been drinking or under drug influence.
1. CALIFORNIA DATA - STATEWIDE CHARTS
The three statewide charts show the DUI crashes and injuries compared to total numbers of crashes and injuries. The default charts show the combined alcohol- and drug-related data.
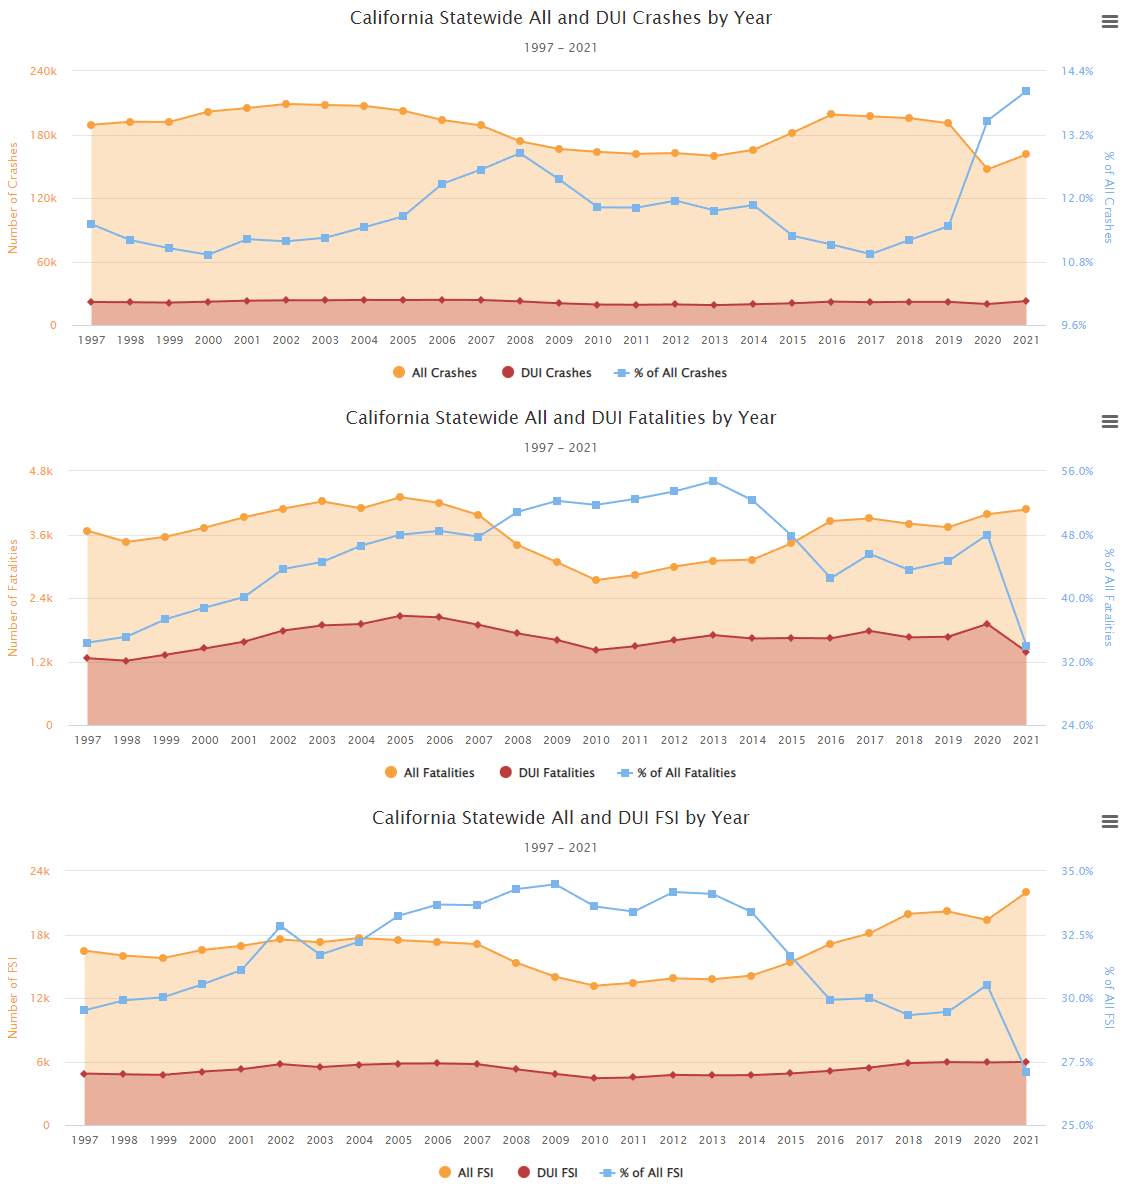
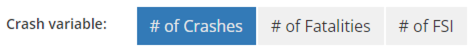
Users may select from three type of crashes to create charts from the options below the chart area:

2. CALIFORNIA COUNTY MAP AND TABLE
The statewide map visualizes the DUI data for each county based on the type of crashes selected from step 1. In addition, users may select to view the number of crashes, number of fatalities, or number of fatalities and serious injuries (FSI) involved in selected DUI crashes.
The default year ranges are the latest five years of final SWITRS data available. Users also have the option to revise year range selections:

California County Map
The map shows the percentage of selected crash variables versus total numbers.
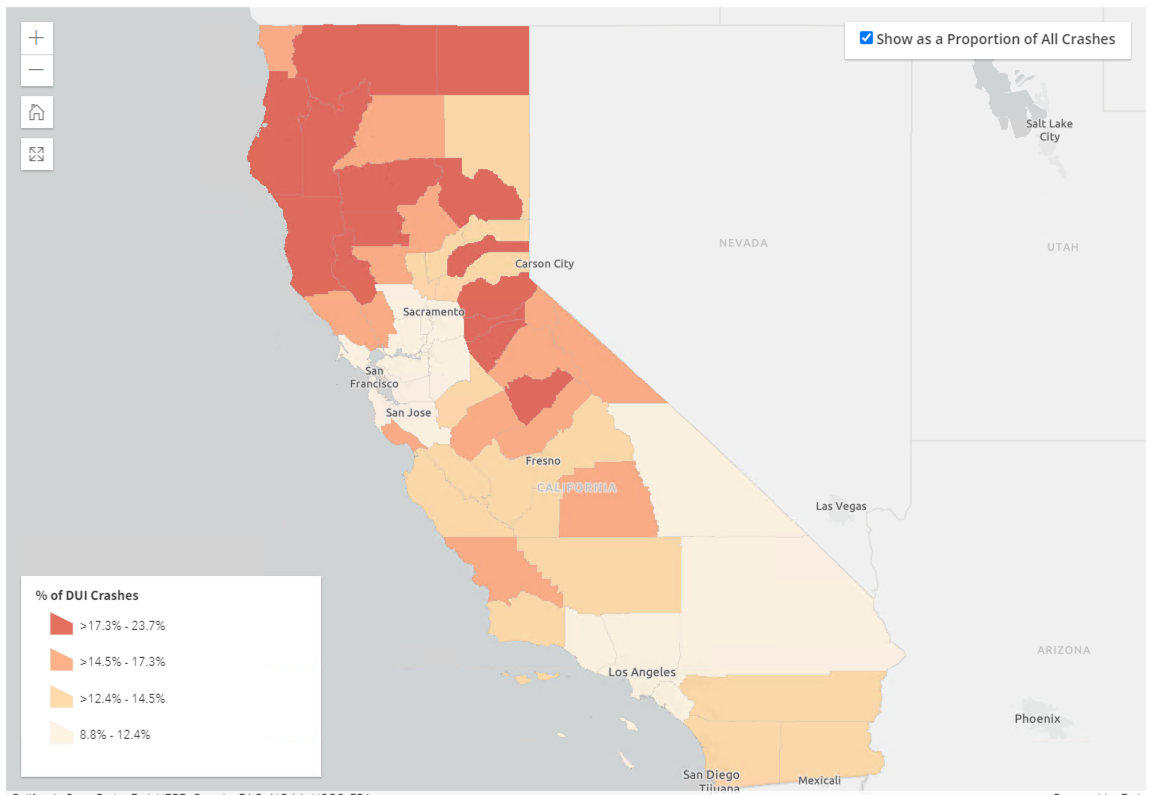
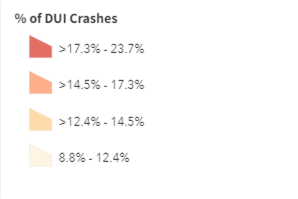
The map is color coded by assigning the same number of data values to each quartile. The legend to the lower left shows each data break. 25 percentile includes crashes under or equal to 12.4%, 50 percentile includes crashes under or equal to 14.5%.
Users may update the map to show absolute numbers by unchecking the option on the upper right corner of the map:

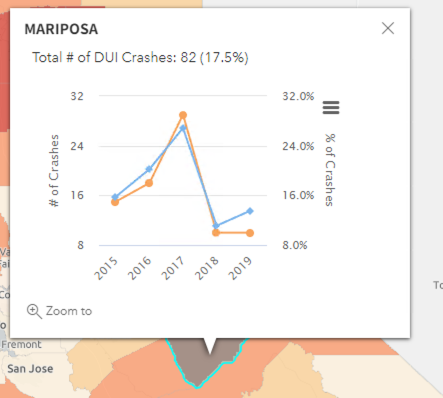
When clicking on a county, a popup will show yearly trends with both absolute numbers and proportional rates compared to total numbers:
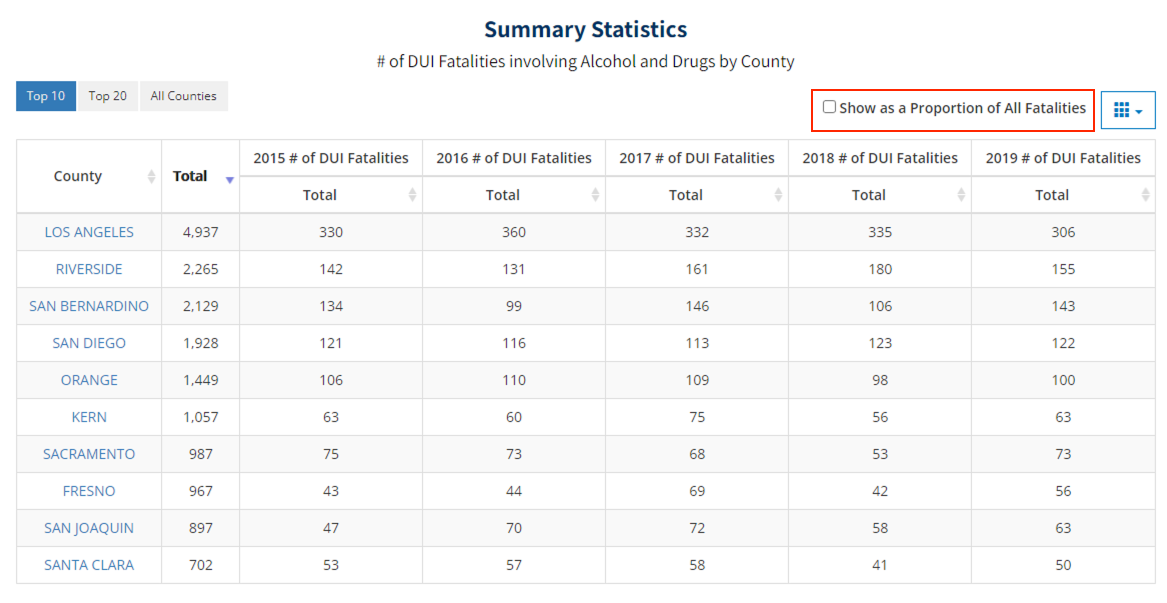
California County Table
The table in this section shows the data used to create the map sorted by total numbers or proportional rates.
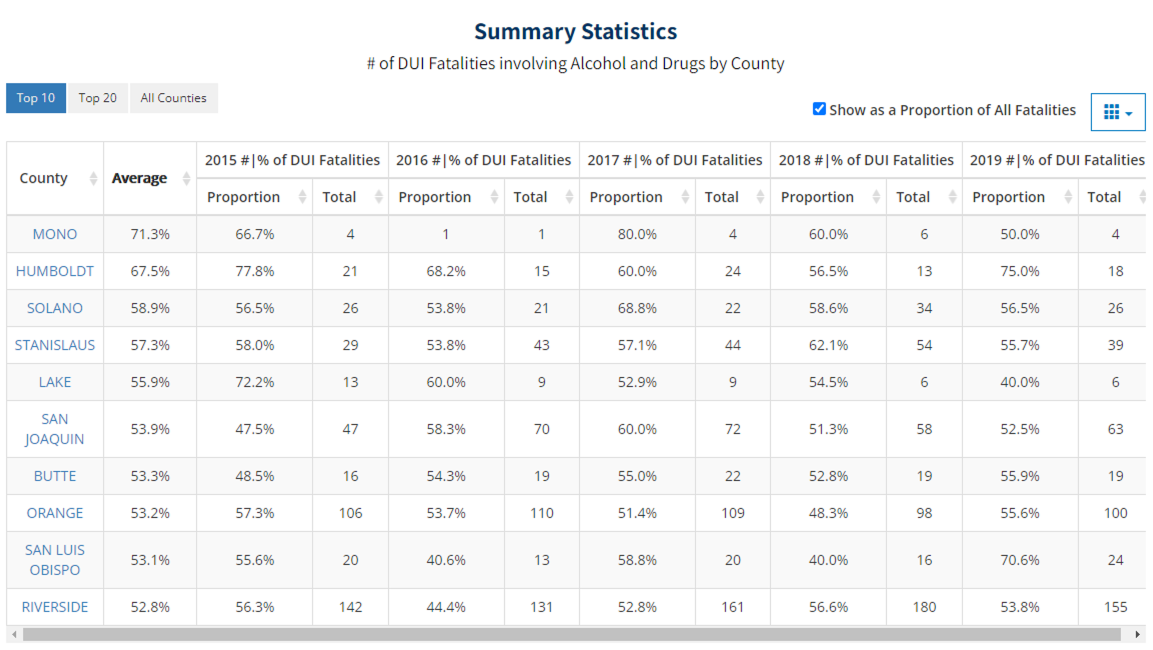
Users may select the top 10, top 20, or all the counties in California using the options from the table section:

Similar to the map, users may update preferences to show absolute numbers using the highlighted checkbox:
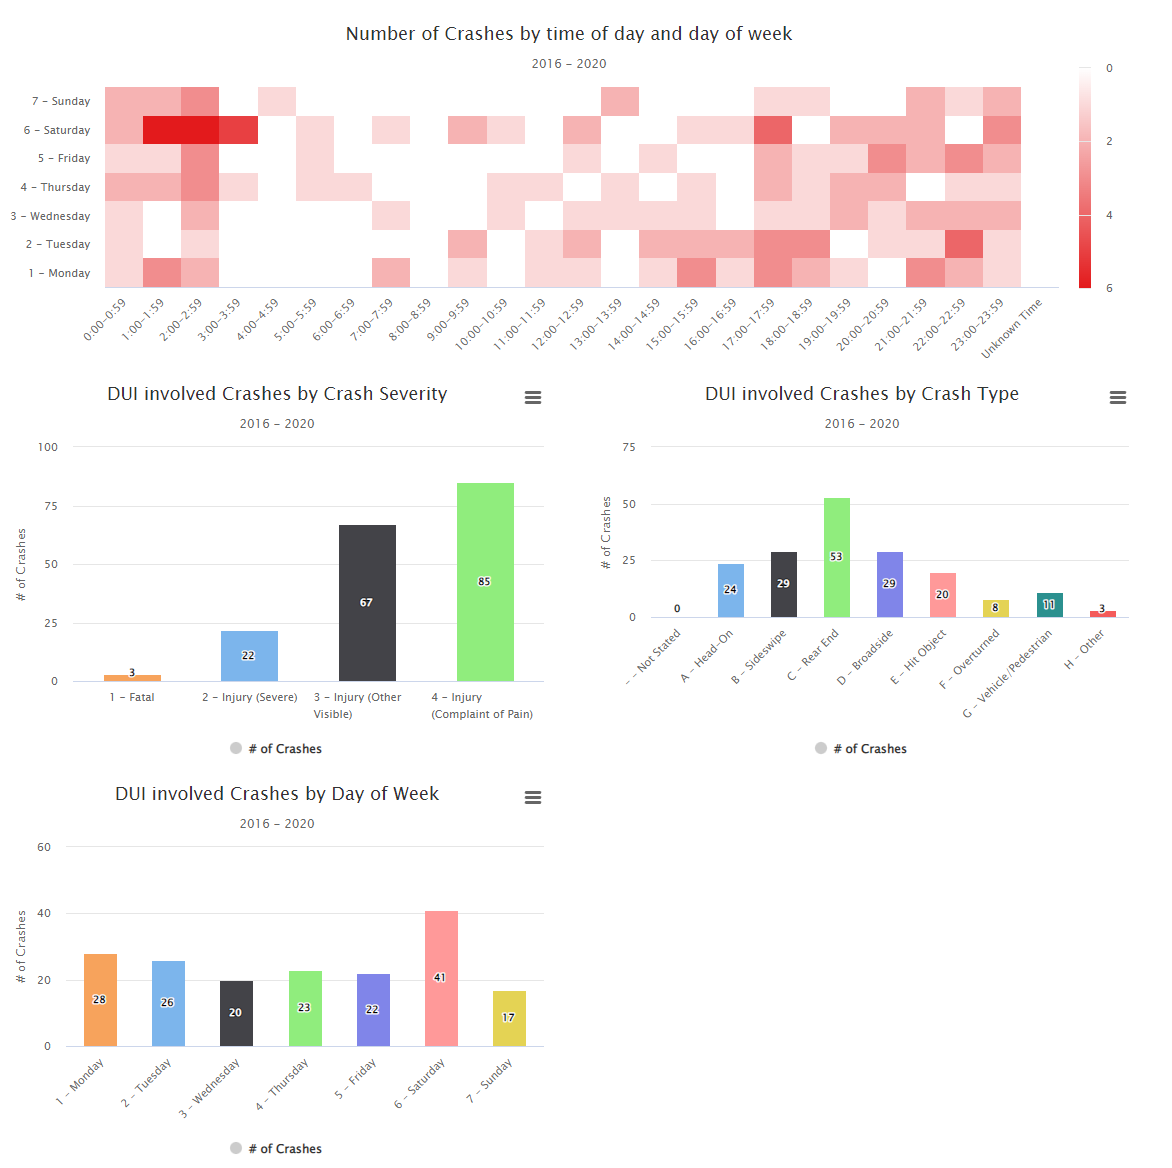
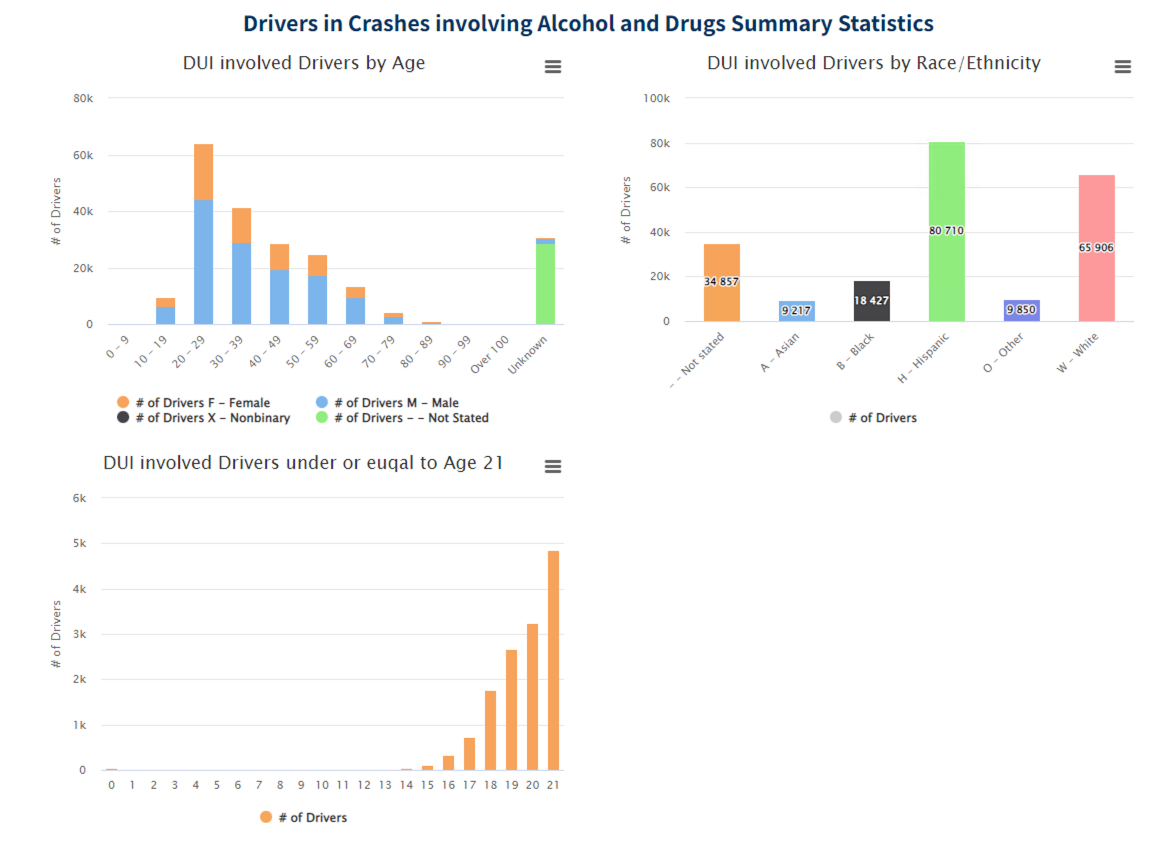
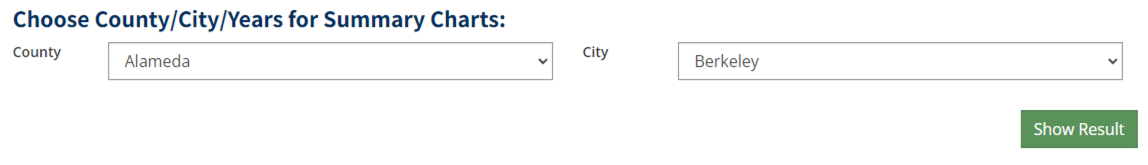
3. COUNTY OR CITY SUMMARY
In this step, users may select a County or City to create charts based on selections from step 2. The options from step 2 inlcude selections for alcohol- and/or drug-related data, selections for all/fatal/FSI crashes, and year range selections.
NOTE:
- For the entire county, users should select "All".
- For only the crashes within the County's jurisdiction, users should select "Unincorporated".
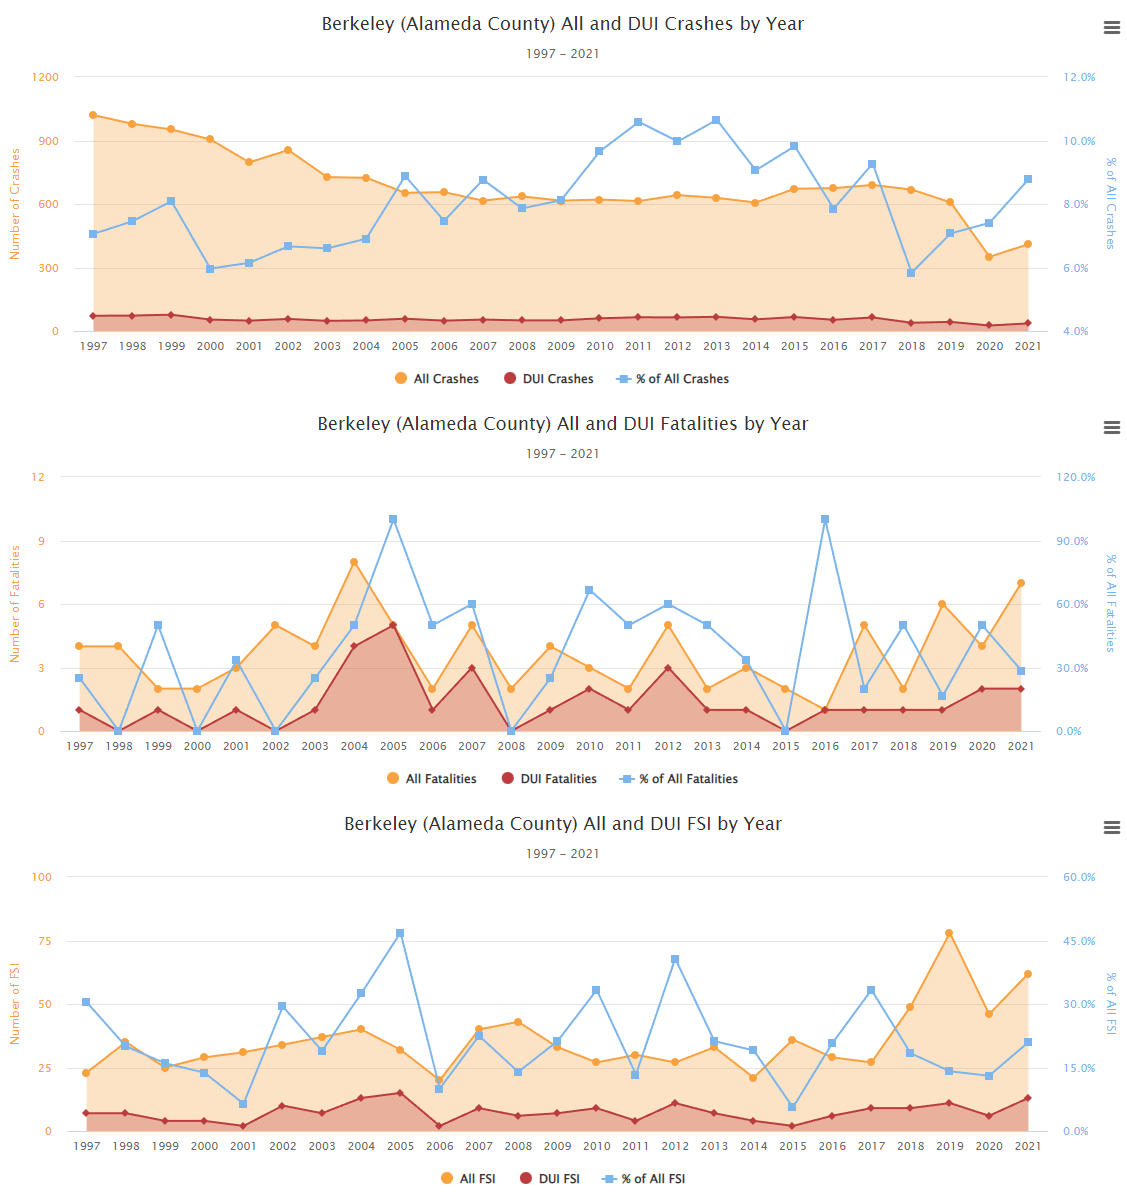
Summary Results
When a county or city is selected, yearly summary result charts for the selected area will be shown here. The yearly charts are similar to the statewide charts from step 1.
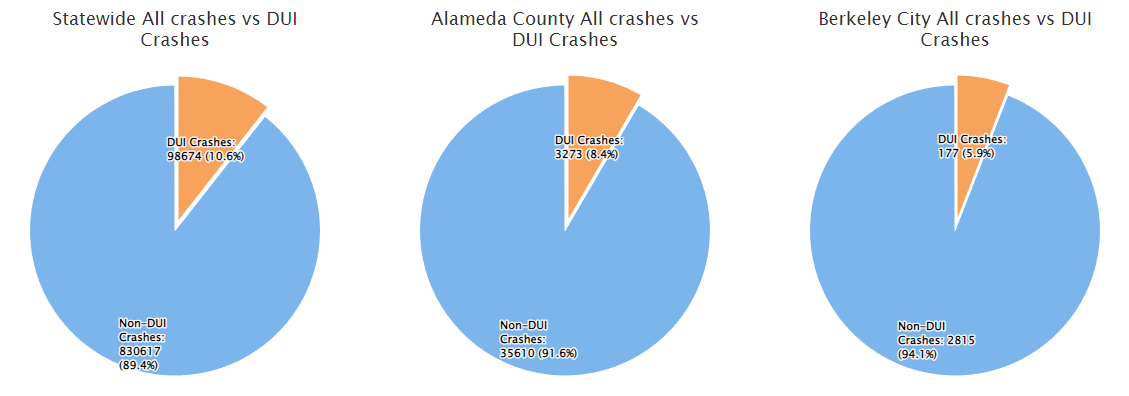
Summary pie charts section shows a comparion for statewide and selected county/city crashes.
Additionally, summary charts at the crash, driver, and victim level are shown in this section as well.