Introduction
These tutorials demonstrate how to select crash data with the SWITRS GIS Map tool for potential use in Highway Safety Improvement Plan (HSIP) applications. Please refer to the SWITRS GIS Map user guide if you are not familiar with the SWITRS GIS Map application; it will explain the various functions and tools available in the SWITRS GIS Map. These tutorials will focus on showing you how to select data for three example projects and then how to download that data for later use in your application for HSIP funding.
A. Segment/Median Project
This example will show how to select data for a segment/median project, where the countermeasure may be to create directional median openings.
The tutorial will cover how to:
- Enter date and location parameters
- Use the location search bar
- Refresh crashes within a current extent
- Switch basemap
- Select crashes using either Drawing tool: Free Polygon or Polygon tool
- Save screenshot for record-keeping
- Download crashes
Parameters for Segment/Median Project
- Time frame: 1/1/2004 — 12/31/2011
- County: Shasta
- City: Redding
- Corridor of Interest: Lake Blvd (from West to East: Northpoint drive to N. Market Street)
1. Open up the SWITRS GIS Map tool
From the main TIMS menu go to the Tools dropdown menu and select SWITRS GIS Map. Then, click on "Click Here to Open SWITRS GIS Map".
2. Enter Date Frame and Location Parameters
Enter the given Date and Location parameters for this project. You can either type these in or select from the respective drop-down menus.
3. Find Area of Interest using Location Search Bar
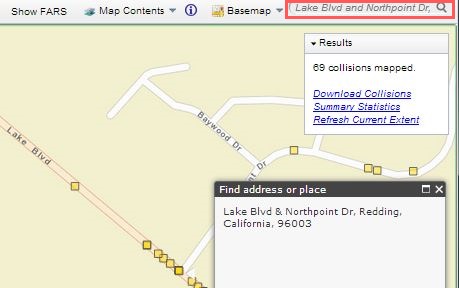
The corridor of interest in this project is Lake Blvd, from Northpoint Drive to N. Market Street. Use the Location search bar  by typing in the intersection "Lake Blvd and Northpoint Dr, Redding". Click on the Search icon. You should be taken to the intersection and a dialogue window should appear showing the location. Use the Pan tool to move the map right and zoom out until N. Market Street is also visible. When the map is showing all 3 corridors of interest, click on Show Crashes > Refresh Crashes > Current Extent to map only the crashes within the current extent.
Note: Notice that a warning notification pops up on the right after you click on Show Crashes. Due to web browser performance considerations, the number of crashes that can be displayed on the map at any given time is 1,000.
Tip: The blue transparent city layer can be turned off by going to Options > Display > Uncheck Display city boundary.
4. Switch Basemap
For this potential segment project, where the countermeasure is a directional median opening, crashes that occurred at intersections should not be included. In its current view, it is difficult to discern which crashes occurred at intersections and which did not. It may be helpful to switch basemaps. By default, the SWITRS GIS Map tool is Streets. To switch basemap, under Basemap, click on Imagery. Notice that it is now easier to spot which crashes did or did not occur within an intersection by being able to see where the pedestrian crossings are marked.
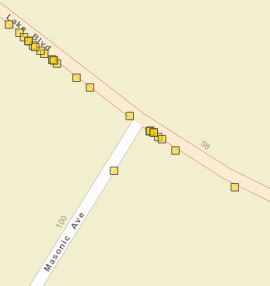
Before: Streets basemap
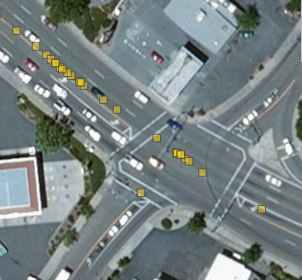
After: Imagery basemap
5. Select Crashes using Drawing Tools
Option A: Free Polygon Tool
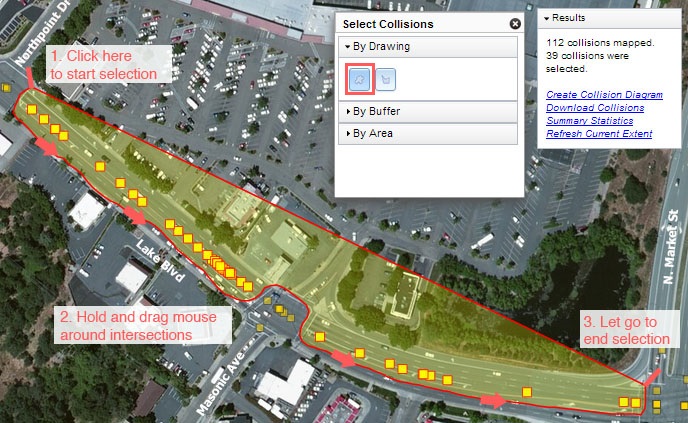
Now that it is easier to distinguish which crashes are intersection vs. non-intersection, select the non-intersection crashes along the corridor by using a Drawing Tool. Go to Tools > Select Crashes > By Drawing > Free Polygon tool. Use your mouse to draw around the crashes, as shown in the picture below. There should be 39 crashes in your selection.
Option B: Polygon Tool
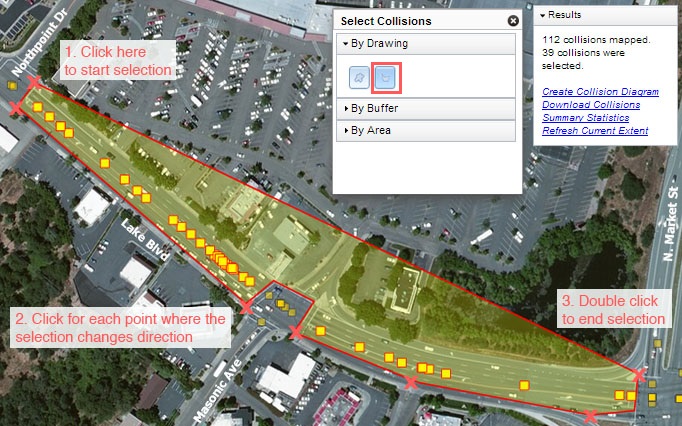
You can also use the Polygon tool to perform the same task. This may be easier for some users since the Polygon tool does not require you to hold down the mouse button while drawing, as it did with the Free Polygon tool. Below is an image of the selection using the Polygon tool. Again, there should be 39 crashes in the selection.
6. Get Summary Statistics
Before deciding if you want to continue and download the crash data, you can quickly learn more about them by clicking on Summary Statistics in the Results box. A pop-up window should open next, in which you can review the tabs for Injury Severity, Crash Type, Primary Crash, and Involved With statistics. 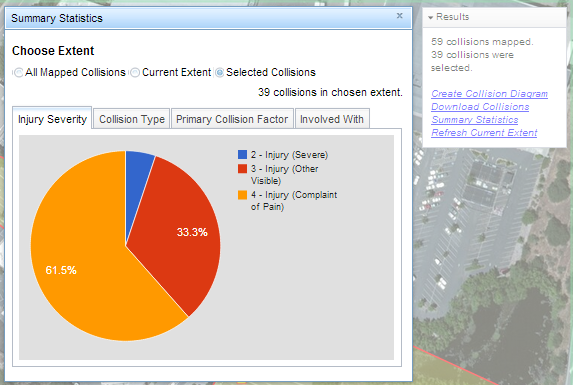
7. Download Crashes
Tip: When you are ready to download the crashes, first take a screenshot that includes your selected parameters and selected crashes. This may be helpful as a reference to remember which crashes were selected and downloaded within the context of the bigger map. Name the screenshot appropriately.
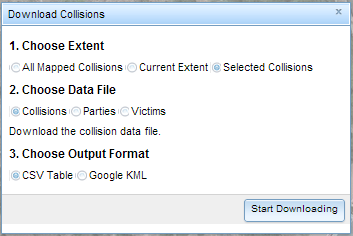 To download the selected crashes, go to the Results box and click on Download crashes. The following pop-up window will appear, and Selected Crashes, Crashes, and CSV Table should already be chosen as the default options. Click Start Downloading to download the selected crashes for later use in building your HSIP application.
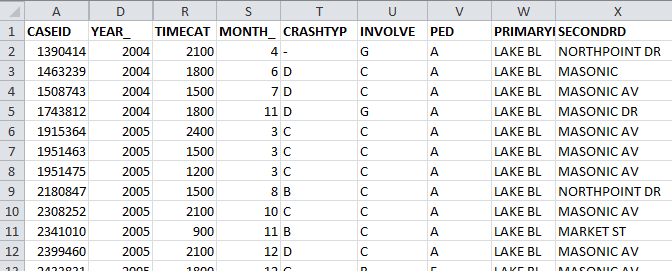
Open the Crashes spreadsheet in a spreadsheet editor such as Excel, and your data should look similar to the below image.
B. Edge Lines, Center Lines, and Markings Project
This example will show how to select data for a potential edge line, center line, and markings project.
(New topics) The tutorial will cover how to:
- Select crashes using the Buffer-Polyline tool
- Use the Deactivate tool to deselect crashes
- Use Microsoft Excel to remove duplicate records
Parameters for Edge Lines, Center Lines, and Markings Project
- Time frame: 1/1/2004 — 12/31/2011
- County: Nevada
- City: All
- Corridors of Interest:
- Brunswick Road (from North to South: Bubbling Wells Rd to Greenhorn Rd)
- Idaho Maryland Rd (from West to East: Brunswick Rd to Madrone Forest Dr)
1. Select Date Frame and Location
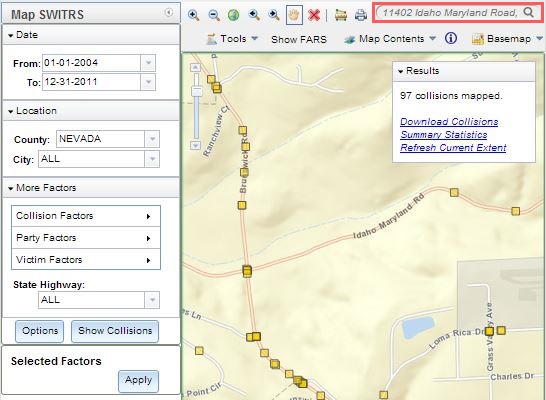
After opening up SWITRS GIS Map, enter the time frame and county for this example as displayed in the left pane in the picture below. Next, type in "11402 Idaho Maryland Rd, Grass Valley" in the Location search bar. Continue panning and zooming out until you get a similar view as below. Once you have located the two corridors of interest, Show Crashes > Refresh Crashes > Current Extent.
2. Select Crashes using Drawing Tools
Option A: Select crashes using the Free Polygon Tool — not recommended
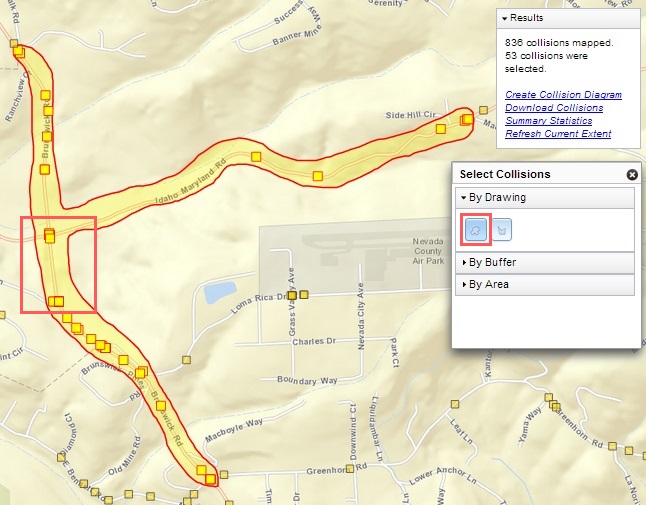
One way to potentially select data along these two corridors is to use the Drawing > Free Polygon tool that was explained in the first tutorial. Carefully navigate to the area of interest with your mouse, as shown below. You should have around 53 crashes selected.
There are two potential issues with using this tool for this selection. One, this tool won't work for two or more unattached areas. To do that, you would have to select data using a different tool and combine the crashes later; this process is explained in Option B.
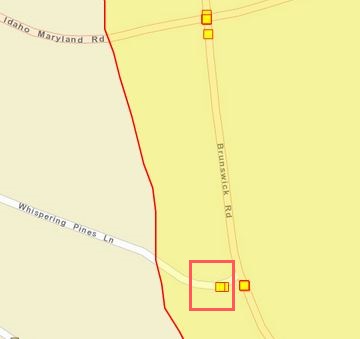 The second potential issue is that it may be difficult to be precise enough to select only those crashes that occur on the main corridor and not include the off-corridor crashes. The image on the right is a close-up of the red-outlined box from the above map. Notice the two crashes that have been included in the selection even though they are not on either of the two corridors of interest.
Option B: Select crashes using the Buffer by Polyline Tool — recommended
If you are working on an area of interest where two or more corridors do not connect and/or you are interested in selecting only the crashes that occurred on a corridor, it may be more accurate to use the Buffer Polyline tool.
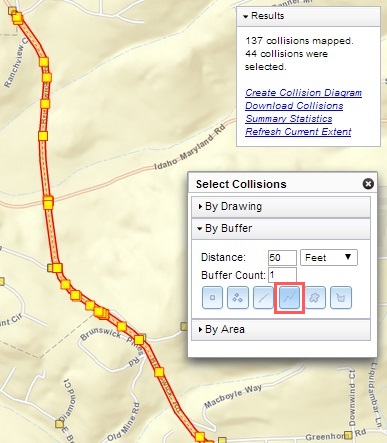 Select the Polyline tool under By Buffer. Type in 50 feet as the buffer distance of your polyline. Click your mouse to start drawing a line down the corridor of interest, and then click for each time the road changes direction. Double-click to finish selection. As you can see from the picture to the right, there are about 44 crashes along Brunswick Rd, from Bubbling Wells Rd to Greenhorn Rd.
Tip: Remember that you can also Switch Basemap to Imagery and/or run through Summary Statistics to check if you are selecting the right crashes and to quickly learn more about them before downloading.
Download Crashes when you are satisfied with the selected crashes. Take a screenshot to keep a record of which crashes you have selected and downloaded.
Next, select the crashes along the Idaho Maryland Rd corridor, from Brunswick Rd to Madrone Forest Dr. To make a new selection, you can either simply start drawing a new polyline, or click on the Deactivate button  to clear the previous selection. Again, using the Polyline tool, draw a line over the Idaho Maryland Rd corridor. 14 crashes should be selected. Download Crashes.
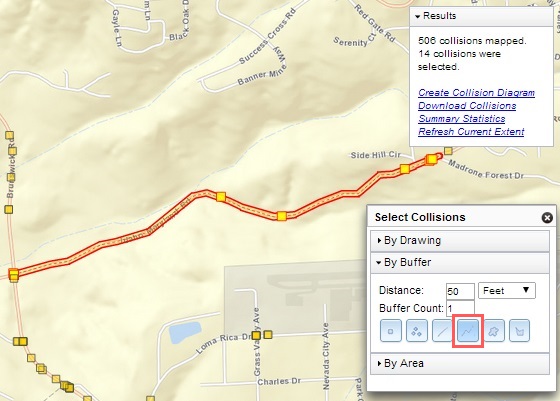
3. Combine Crashes
To use the Benefit/Cost tool, the crashes data for both these corridors needs to be combined into one spreadsheet. To do this, you can simply either:
- Option A: Copy one set of crashes data from one spreadsheet and paste to the other.
- Option B: Copy and paste both sets of crashes data into a new spreadsheet.
4. Remove Duplicate Crashes
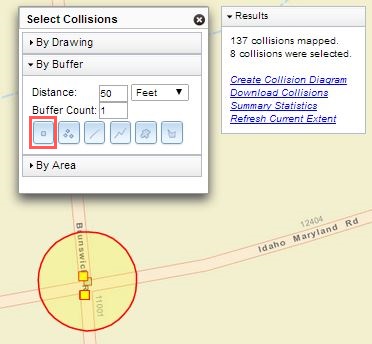 Since there were 44 crashes along Brunswick Rd and 14 along Idaho Maryland Rd, there are a total of 58 crashes in this new combined spreadsheet. However, based on the total of crashes (53) when the Free Polygon tool was used in Step 2, you know that there might be some duplicates in your new spreadsheet. You can also deduce this by zooming in to the intersection of these two corridors and realizing that there are about 8 crashes in the intersection of these 2 corridors.
There are 2 ways to remove the duplicate records, manually or automatically.
Option A: Removing Duplicate Records Manually
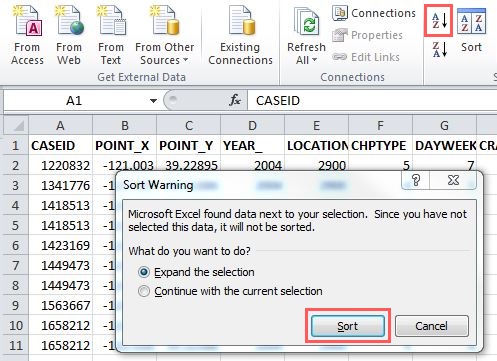
Since the dataset for this example is small enough, you should easily be able to pick out the duplicate crashes. First, to view your crashes in sequential order by Case ID numbers, use the Sort function in Excel. Highlight the Case ID column, and then Data > A to Z Sort > Expand the selection > Sort.
You can now scroll through your spreadsheet and identify the duplicate crashes. These duplicates have been manually highlighted in red below.
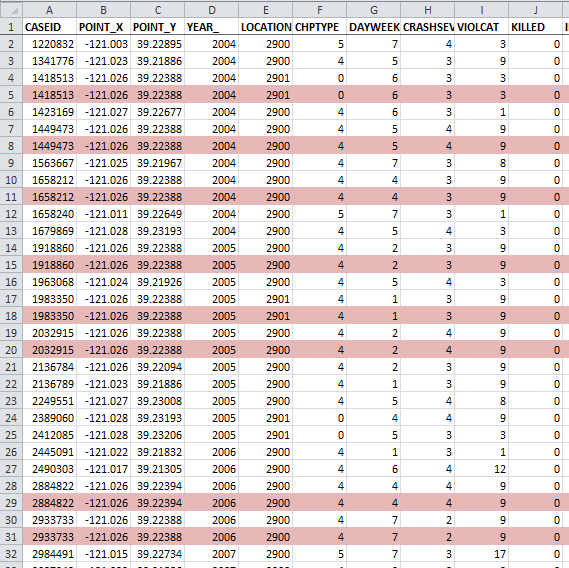
Delete these records and you will have a cleaned up, combined spreadsheet of the crashes along the two corridors of interest. Save the spreadsheet for later use in building your HSIP Application.
Option B: Removing Duplicate Records Automatically
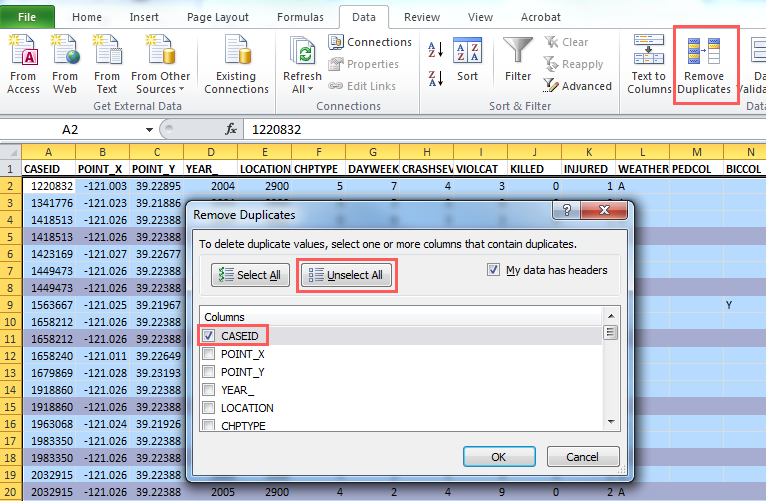
You can also use the Remove Duplicates function in Microsoft Excel instead of looking for them manually. This function is helpful for larger datasets. The function can be found in Data > Remove Duplicates. Check the boxes for 'My data has headers' and then 'CASEID'.
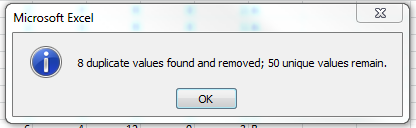
After you click OK, a notification window will pop up telling you how many duplicate values have been found and removed.
Save this spreadsheet for later use in the Benefit/ Cost Calculator tool.
C. Pedestrian Countdown Signal Heads Project
This example will show how to select data for a potential pedestrian countdown signal head project.
(New topics) The tutorial will cover how to:
- Choose crashes by Crash Factors: pedestrian or bicycle crashes
- Select crashes using the Buffer-Multi-point selection tool
Parameters for Pedestrian Countdown Signal Heads Project
- Time frame: 1/1/2004 — 12/31/2011
- County: Los Angeles
- City: Pomona
- Corridor of Interest: Phillips Blvd (5 intersections from S Park Ave to S San Antonio Ave)
1. Select Date Frame and Location
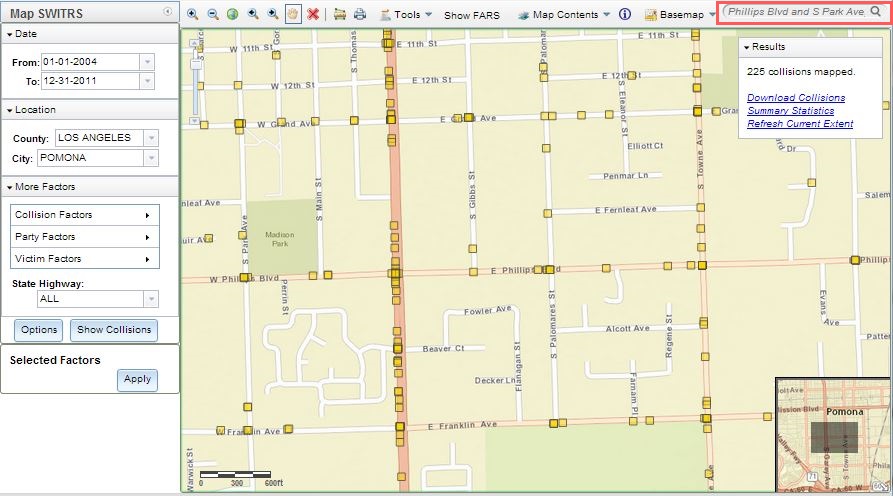
After opening up SWITRS GIS Map, enter the time frame, county, and city for this example as displayed in the left pane in the picture below. Next, type in "Phillips Blvd and S Park Ave, Pomona" in the Location search bar. Pan right and zoom out until you get a similar view as below. The other N-S corridor that you will be looking for is S San Antonio Ave. When all the corridors of interest are in sight, Show Crashes > Refresh Crashes > Current Extent.
2. Select Crash Factors
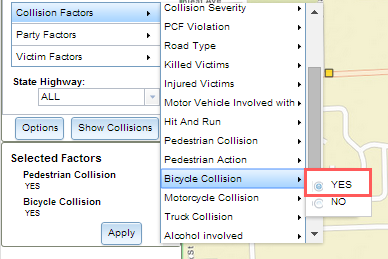 For this project, where the potential countermeasure is installing a pedestrian countdown signal head, only the bicycle crashes and pedestrian crashes are of interest. To select these crashes, go to Crash Factors > Pedestrian Crash > Yes, and then Crash Factors > Bicycle Crash > Yes. These two factors should now come up under Selected Factors. Hit Apply.
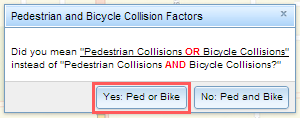 A pop-up window should now come up asking if you are interested in "Pedestrian Crashes OR Bicycle Crashes" or "Pedestrian Crashes AND Bicycle Crashes". Since you are interested in crashes that could either be a pedestrian crashes or a bicycle crashes, and not crashes that involved both a pedestrian and a bicyclist, click Yes: Ped or Bike.
3. Select Crashes using Buffer Tool
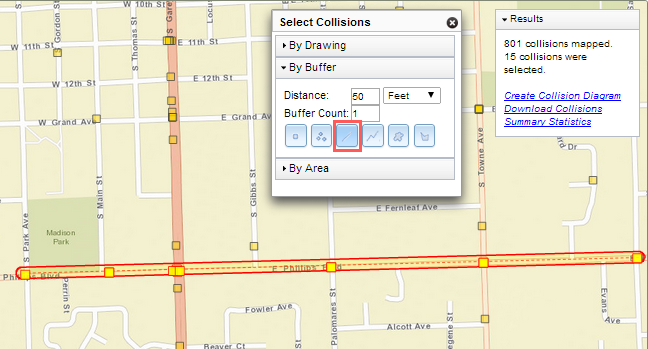
You can select all the crashes along a corridor using the Buffer > Line tool. Change the buffer distance to 50 feet. Then, click on the first intersection, and hold and drag the mouse over the other intersections along the corridor. Let go to finish selection. 15 crashes should be selected.
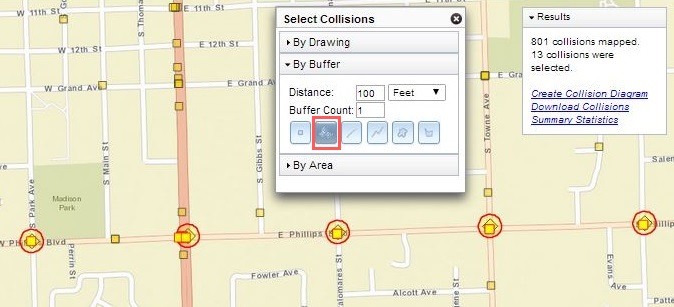
For this particular project however, you are only interested in crashes that occurred at intersections. Thus, to only select crashes around selected points, go to Buffer > Multiple Points. Change the buffer distance to 100 feet, click at the 5 intersections along E. Phillips Blvd, and double-click to finish the selection. You should now only have 13 crashes selected. Notice that the 2 crashes (E. Phillips Blvd and S. Main St) that did not occur at an intersection have been omitted.
4. Download Crashes
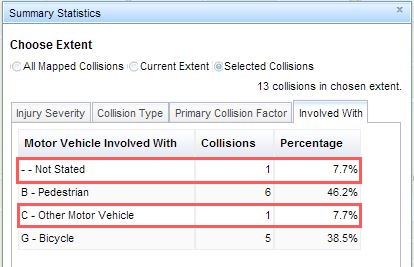 Check Summary Statistics, save screenshot, and then Download Crashes when you are satisfied with the selected crashes.
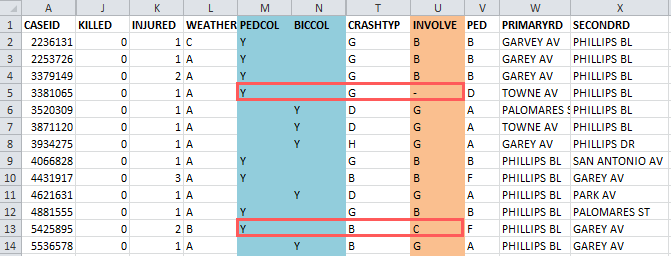
Note: There are 2 crashes (1 not stated and 1 Other Motor Vehicle) in the Summary Statistics that seems to involve neither a pedestrian nor bicyclist. To understand this, open up and examine the downloaded crashes spreadsheet. Records #5 and 13 are the two crashes that seemed to involve neither a pedestrian nor bicyclist. In Column U: INVOLVE (Motor Vehicle Involved With), - = Not State; C = Other Motor Vehicle. However, if you look at the columns for PEDCOL and BICCOL (pedestrian crashes and bicycle crashes, respectively), you will see that there's a Y for Yes in either of the columns for both these records. This is because under the California Highway Patrol Collision Investigation Manual, for MOTOR VEHICLE INVOLVED WITH, the patrol officer marks "one element which...produced the first injury or damage event on or off the road". Thus, if you only looked at the INVOLVE factor, you would be missing the pedestrian and bicycle crashes that were not marked as such even though they were involved.