Introduction
The Safe Routes to School Crash Map Viewer provides a simple means to explore pedestrian and bicycle crashes near schools in California. The viewer uses data accessed from the California Department of Public Schools Database. At the time of data retrieval, latitude and longitude coordinates were provided for each school, and since we did not develop this database, we cannot be responsible for location or other errors for the school data. Note that our tool allows users to enter a specific address rather than browse for a school so any location can be accommodated.
To use this tool, click on SRTS Map Viewer from the Tools dropdown menu.
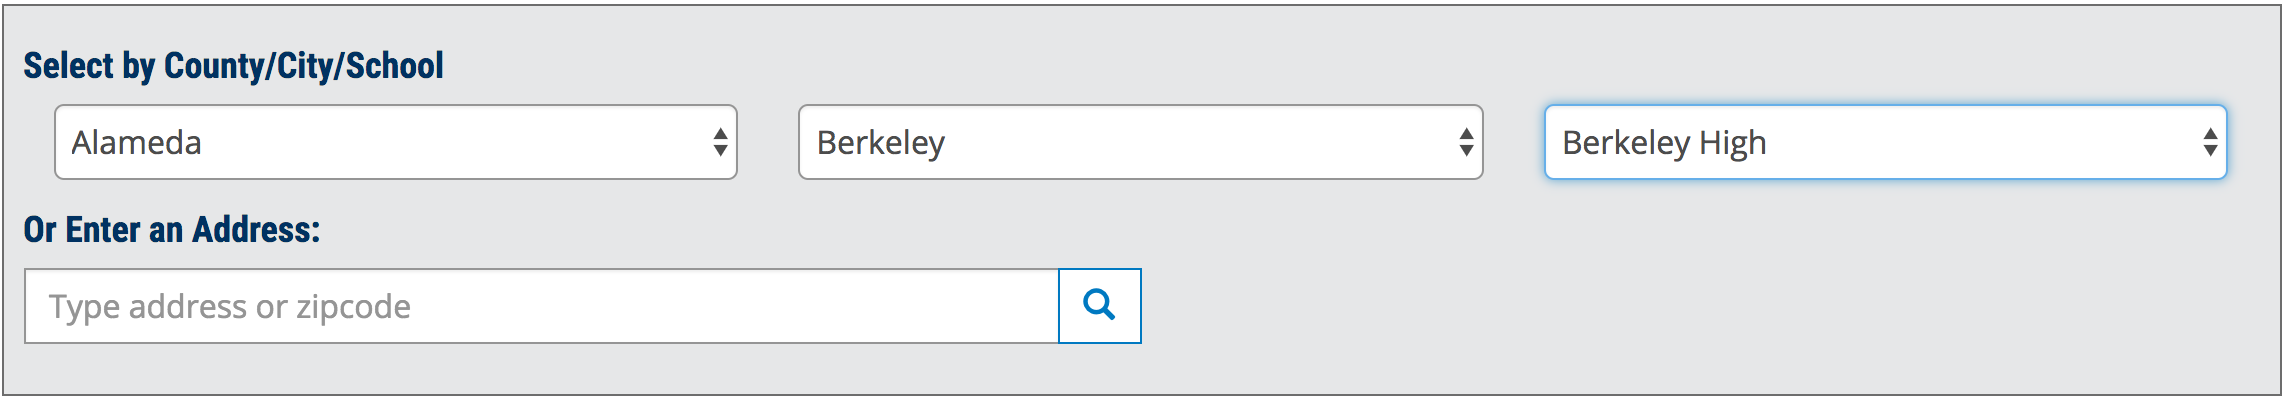
1. Select Location
First, select a County/City/School, or enter an address:
2. Select Factors
Next, the page will open up and the selected location will be loaded onto the map. Users can select:
- Bicycle or Pedestrian crashes
- Severity levels (Fatal, Severe Injury, Other Visible Injury or Complaint of Pain)
- Years
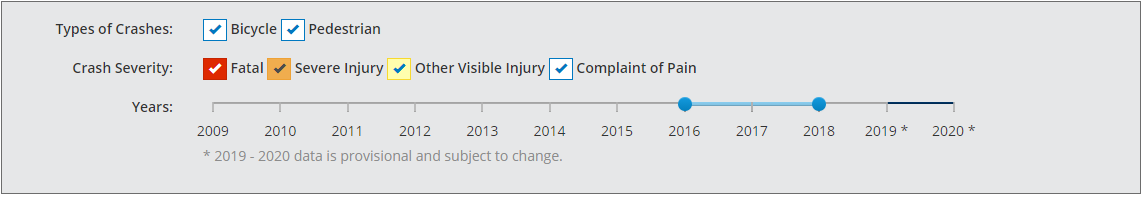
The selected options will automatically update on the map.
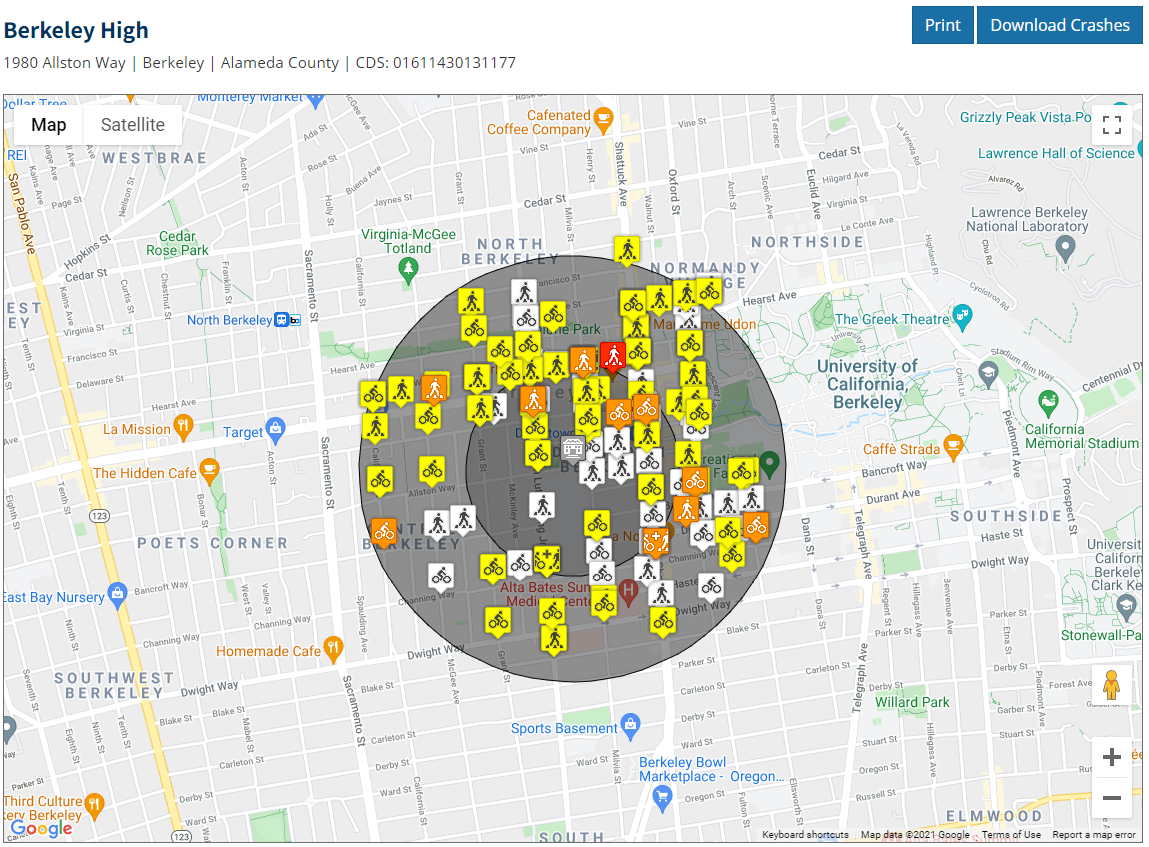
The crashes are represented by color-coded symbols. Colors indicate the severity level; symbols represent whether a pedestrian, bicycle, or both were involved.
| Crash Severity | Involvement | ||
|---|---|---|---|
| Bike | Pedestrian | Both | |
| Fatal |  |
 |
 |
| Injury (Severe) |  |
 |
 |
| Injury (Other Visible) |  |
 |
 |
| Injury (Complaint of Pain) |  |
 |
 |
By clicking on an individual icon on the map, a summary of the crash details will appear, with a link to the interactive Google Street View profile page.
3. Other Features
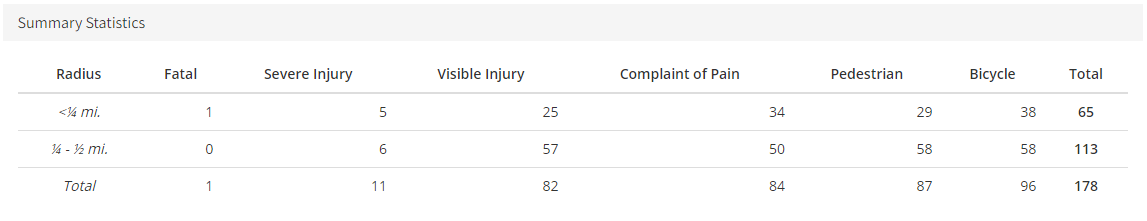
Summary Statistics
The total count of crashes by severity and type are shown within a .25 to .50 mile radius. The list automatically updates depended on the selected options.
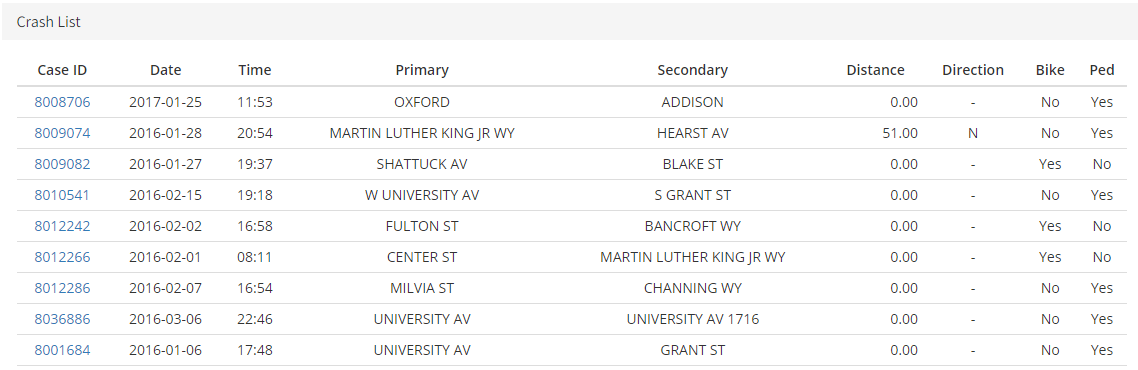
Crash List
A list of crashes that are shown in the map are displayed with several basic fields regarding the location. The distance and direction refer to the offset distance from the secondary road along the primary road. Clicking the CASEID field zooms to the crash on the map.
This provides a regular printout page of the selected crashes, the map, summary statistics, and the crash list. It is suggested to print to a PDF if you need a digital copy of the map and details.
Download
The download button allows all the crashes to be downloaded in a spreadsheet (.csv) file. For more information on the meaning of fields, please refer to the SWITRS Resources page.
Frequently Asked Questions
Why do I not see all schools on the maps?
The schools were obtained from the California Public Schools Database. The XY coordinate location of the schools were provided in the database for most records. Some schools without coordinates were geocoded by SafeTREC and other schools were modified for incorrect coordinates. Schools for each city were spatially selected within the city boundaries. If you do not see a school of interest, check the map for the adjacent city or county unincorporated area since the school may have been placed there on the map.