Introduction
The SWITRS GIS Map offers an interactive map-centric approach to viewing and querying SWITRS crash data. To use this tool, click on SWITRS GIS Map from the Tools dropdown menu. Then, click on Click Here to Open SWITRS GIS Map. This user guide provides instructions on how to use the tool's many different functions.
Web Browser Compatibility
The SWITRS GIS Map is designed to run in many different web browsers. For optimal viewing experience and full functionality, we recommend the latest versions of Internet Explorer, Mozilla Firefox, or Google Chrome.
Page Layout
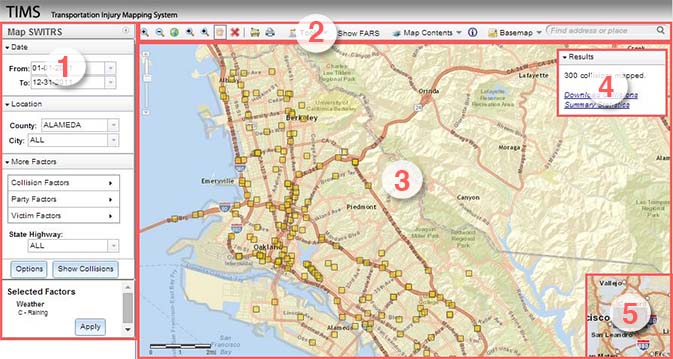
Map SWITRS Panel
The Map SWITRS panel is displayed on the left side of the browser window. All the functions to query SWITRS can be found in this panel. It can be minimized to the left by clicking on the arrow in the top right corner. If you are using a small screen, you can also collapse the different categories by clicking on the title menu bar for Date, Location, or More Factors. Selected factors will be shown at the bottom of the panel.
Toolbar
The navigation toolbar, tools, map contents, basemaps, and location search bar are located in the horizontal bar across the top of the map.
Map
The Map is the main component of the application; it is where crashes and other data layers are displayed. Other windows can be minimized to maximize the map extent.
Results
The results window is shown hovering over the map in the top right corner. After showing crashes on the map it will automatically expand to summarize the results and give several options to interact with the data. It will also notify users when the crash display limit has been exceeded.
Overview Map
The overview map is in the bottom right corner. The current extent is shown as a gray box. By dragging the gray box, users can pan the map display. Minimize the overview map by clicking the arrow in the bottom right corner.
1. Map SWITRS Panel
The core functionality of the SWITRS GIS Map is the ability to query and dynamically map the crash data. Many options are available in the Map SWITRS panel.
Date and Location Parameters
Users must first establish a time frame and county/city location. The To and From dates can be selected from a calendar or typed into the Date box. The ten most current years of data are available to query. Note that the most current year available may be a provisional set and only a portion of the final crash records that will eventually be available. Please refer to the FAQs for more information.
Select Crash/Party/Victim Factors
Next, users have the ability to select specific types of crashes based on crash, party or victim specific factors. For example, pedestrian crashes involving older adults could be specified by choosing Pedestrian Crash > Yes in the crash factors and specifying in the victim factors, Victim Age > 65 to 125. When a field such as the Crash Factors > Month is chosen, clicking the Check All or Uncheck All option will check the boxes accordingly.
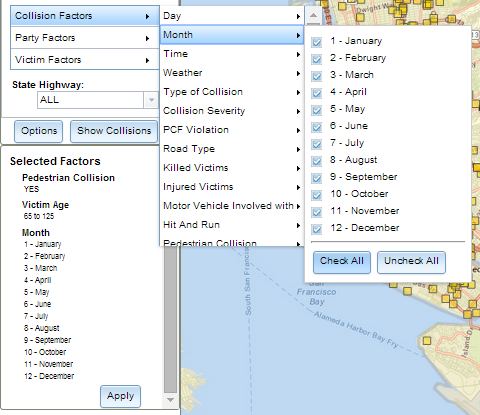
Refer to the codebook in the Help page for more information regarding the fields. Only the most commonly used fields are available to query by in the SWITRS GIS Map tool. The Resources page also gives you more information about Working with the relational database structure that SWITRS data is organized in.
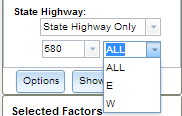
Select State Highway
Users have a final option of narrowing their query based on a state highway designation. The default for this field is ALL, which means that all of the crashes that satisfy the selected time, location, and other selected factors will be shown. Choosing No State Highway will only show crashes not associated with the state highway system.
 Finally, choosing
Selected Factors window
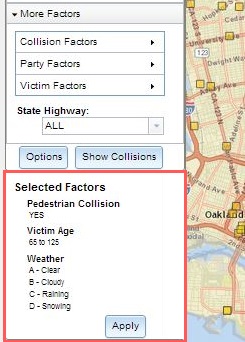 After choosing factors, the Selected Factors window in the bottom left corner will populate with the list of factors in real-time. To remove a factor, hover over that factor and then click on the circle X that then appears to the left. Update the displayed crashes by clicking on the Apply button; the selected crashes will then appear on the map.
Identify Crashes/Crash Details
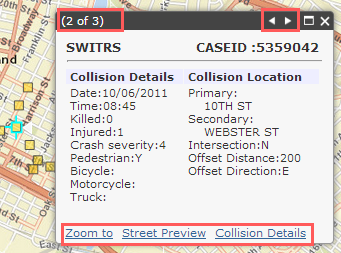 Once the crashes are displayed on the map, you can click on them to get more details. A pop-up will show details about the crash and location. If more than one crash is in the same location, you will see x of total number of crashes in the top left of the dialog. To navigate through the different crashes, click on the small arrows in the top right of the dialog window. There are also three options across the bottom of the pop-up.
- Zoom to: Zooms your map closer into that crash on the map.
- Street Preview
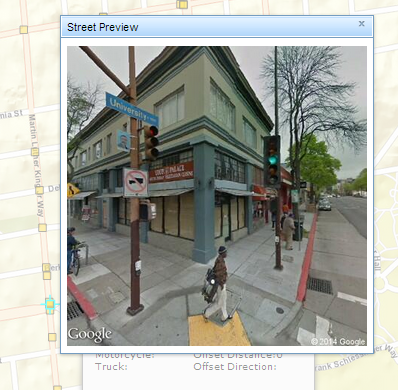 : Opens up a pop-up image of that crash's street scenery via Google Maps.
 - Crash Details
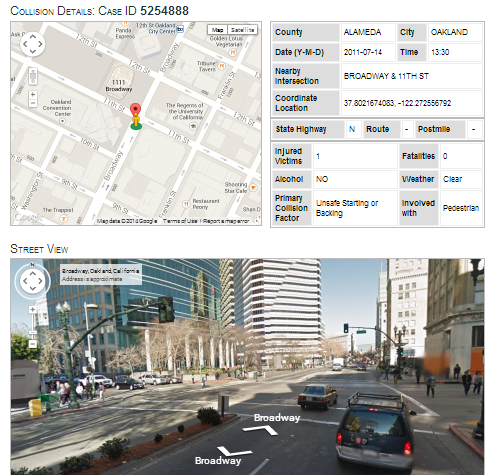 : Opens a new page with a small map, the basic details, and a Google Street View; this page provides an easily printable 1 page summary of the crash.
Display Options
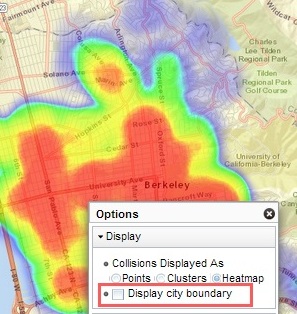
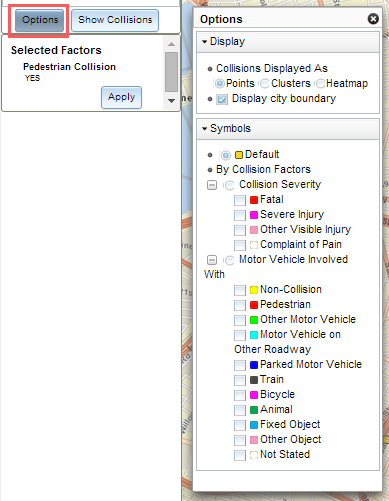 There are several different ways to symbolize crashes. Display options can be changed by clicking Options in the Map SWITRS panel. By default, crashes are shown as points on the map, but they can also be displayed as clusters or as a heatmap.
Display
Crashes Displayed As
- Points
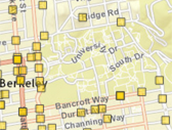 : The default view displays each crash as a yellow square on the map. All tools and features are available for this view.
 - Clusters
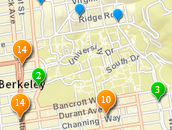 : Clusters aggregate nearby crashes into single larger points. This helps to synthesize areas with large numbers of crashes. Clusters change color and size depending on the number of records represented in white text. Clicking on a cluster shows gray dots of each of the individually represented crashes and the details page can be accessed for each of them.
 - Heatmap
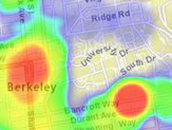 : When heatmap is selected, crashes will be displayed as a matrix of colors, where the dependent variable is the density of crashes. Blue regions represent lower numbers of crashes while red areas represent the highest crash counts.
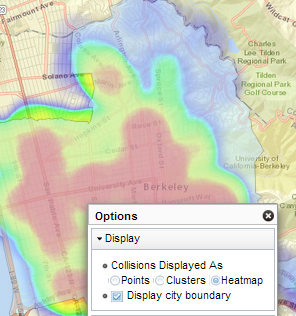
Display City Boundary
By default, Display City Boundary will be checked on. Uncheck this option to turn off the outlined, semi-transparent blue city layer.
Display City Boundary: On
Display City Boundary: Off
Tip: If you are displaying the crashes as a heatmap, turn off this layer so that the heatmap can be displayed more clearly.
Symbols
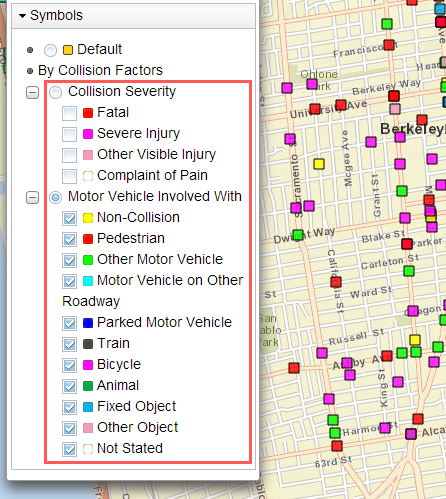 When the default Points style is active, you can also choose to display the crashes as symbols stratified by either Crashe Severity or Motor Vehicle Involved With. After selecting a type of stratification, you can then choose to turn on/off colors for each value.
Explore crash data by using a combination of these display options. The heatmap and cluster options help synthesize large numbers of crashes in the same or similar location. Symbology options help show how different types of crashes are distributed.
2. Toolbar
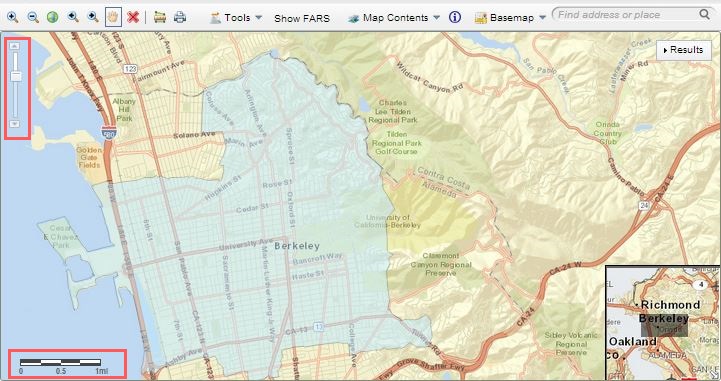
Navigation Tools
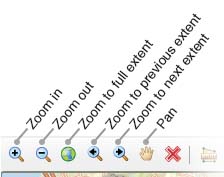
Several options are available for navigating the map. When no other tools are active you can pan the map by left-clicking and holding. You can zoom in/out by using the mouse scroll wheel or the zoom slider in the upper left portion of the map. The toolbar also has several navigation functions:
- Zoom in: Click and drag to draw a rectangle around an area to zoom in on.
- Zoom out: Click and drag to draw a rectangle around the area to zoom out of.
- Zoom to full extent: Gives you view of the world map.
- Zoom to previous extent: Takes you to the previous screen that was zoomed in/out of.
- Zoom to next extent: Takes you to the next screen that was zoomed in/out of
- Pan: Move around the map by left-clicking and holding.
Deactivate
Any active tools can be deactivated by clicking the Deactivate  button. This clears the function and makes a left-click revert to panning.
Measurement Tools
Use a Measurement Tool  to find the area, distance, or location of a polygon, polyline, or point, respectively. These measurements can be taken in different units by simply selecting the desired unit from the dropdown menu. Measurement results are shown at the bottom of the pop-up dialog.
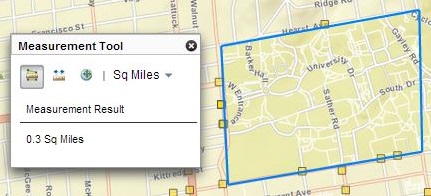 Area Measurement tool: Find the area of a region by clicking at each point of the polygon. Double-click to finish.
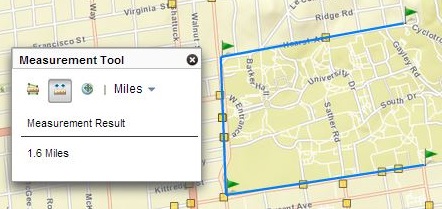 Distance Measurement tool: Find the distance of a polyline by clicking at each point. Double-click to finish.
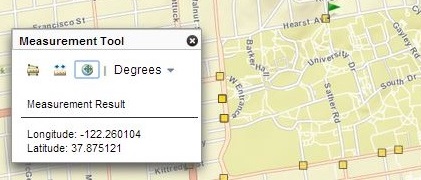 Location tool: Click on a point on the map to determine the latitude/longitude coordinates.
Printing
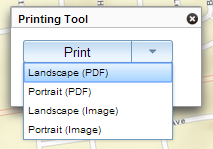 Click the Print
  button in the toolbar to generate a portrait or landscape view of your map; you can save either as a PDF or JPG image file. Selected location and time parameters will be shown as the title of the map. The map printout will also display a scale bar and the date printed.
Tools
The SWITRS GIS Tools can be accessed from the toolbar across the top of the map.
Spatially Select Crashes
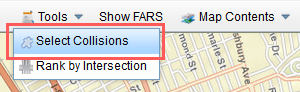 One of the most powerful features of SWITRS GIS Map is the ability to Select Crashes of interest in a region, corridor or intersection. After selecting the crashes, you can review the statistics, create a crash diagram, or download the complete data files to conduct further analyses. There are three different ways to select crashes.
By Drawing
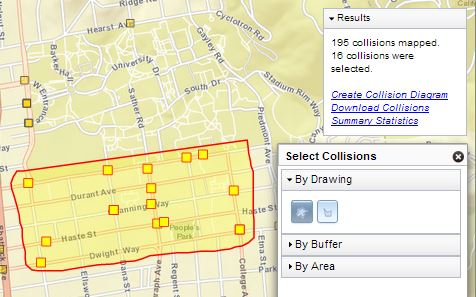 The Select by Drawing tools allow you to draw a shape around the crashes that you want to select. Choose from either the Free Polygon (left) or Polygon (right) tool. Click your mouse to draw around the crashes and let go to complete your selection.
By Buffer
The Select by Buffer tools can give more precise measurements. For example, you may want to select crashes within 25 feet of a corridor (left), or 75 feet of multiple intersections (right).
- Enter a buffer distance.
- Type in the number of buffer rings (Buffer Count) to create.
- Choose a shape. Hovering over a shape button provides a description (e.g. Point, Multiple Points, Line, etc.).
- Follow the on-screen instructions on the map.
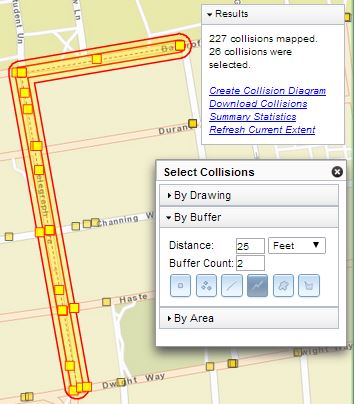
Select by Buffer: Polyline
25 ft, 2 Buffer Count
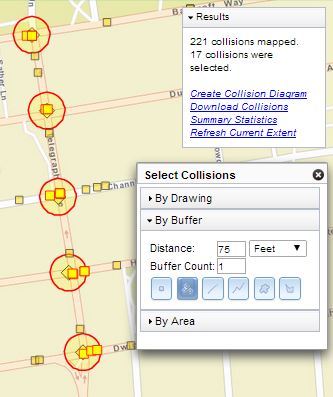
Select by Buffer: Multiple Points
75 ft, 1 Buffer Count
By Area
The Select by Area option allows you to select crashes that occur within one or more geographic zones: choose from Census tracts, traffic analysis zones (TAZ), and Zip codes. After selecting one of these three options, semi-transparent boundaries will be displayed on the map. Click within an area to highlight and select the crashes within it. You can also select multiple areas and deselect an area by re-clicking a highlighted area.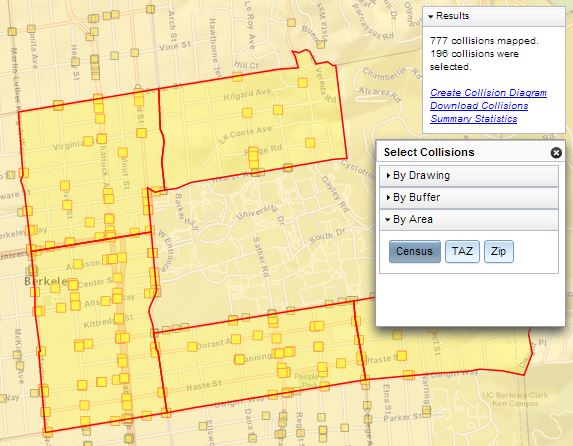
Rank by Intersection
![]() Use the Rank by Intersection tool to rank major intersections by total crash count.
Use the Rank by Intersection tool to rank major intersections by total crash count.
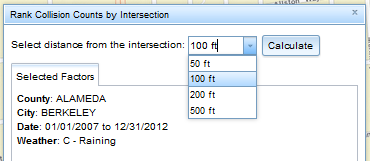 After selecting Rank by Intersection from the Tools menu, select the distance that you want crashes to be included in an intersection's crash count. For each intersection, the higher its rank, the more crashes occurred within it.
Compare the heatmap below with its ranked list of Top 10 Intersections (buffer of 100 ft). Notice that higher ranked intersections are red in the heatmap.
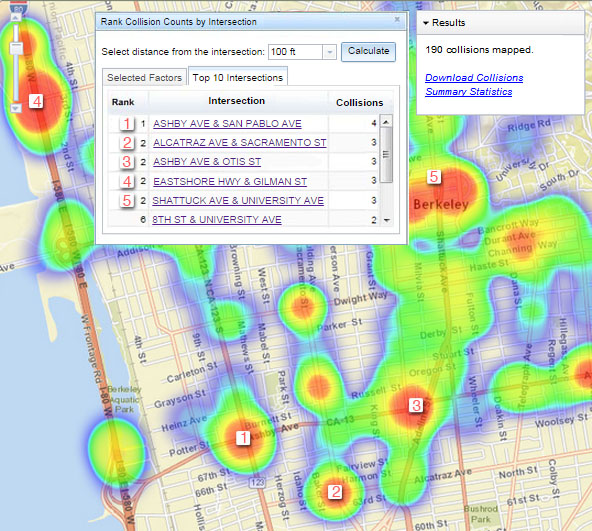
Note: Only crashes that match your selected date, location, and other factors are used. Additionally, this tool only ranks crash counts for intersections in which one of the intersection's roads is a primary road or secondary road. Primary and secondary roads are any of the 10 types of roads listed in the A2 and A3 series. For more info, see this list of Census Feature Class Codes.
Show FARS Data
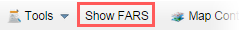 Click on Show FARS from the toolbar to map crashes from the FARS dataset.
Most FARS crash points should overlap with the fatal crashes within your selected time frame. However, there will be a few cases where they do not, as highlighted below. This is due to differences in FARS and SWITRS records as well as the geocoding processes used.
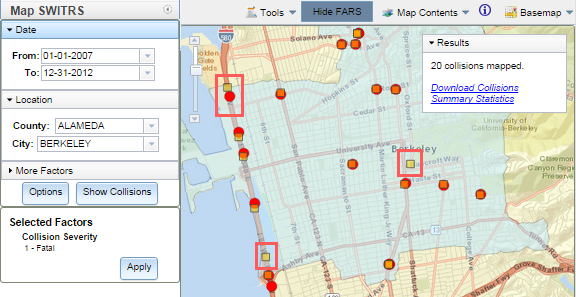
Note: For more information on FARS data, see the National Highway Traffic Safety Administration's FARS website.
Map Contents
Map Contents refer to the different layers that can be displayed on the map and is accessible from the main toolbar. Users can select from several standard layers or import one of their own point layers.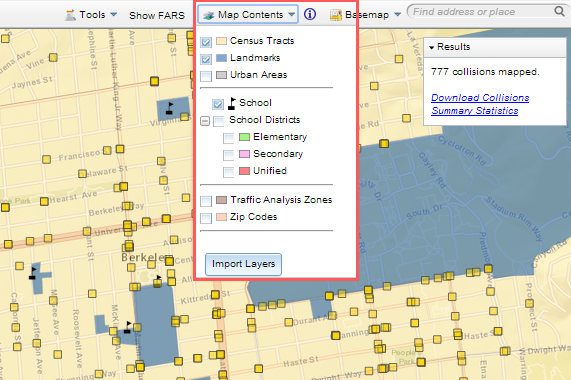
Import Layers
An important feature in the Map Contents is the ability to Import Layers that are saved on a local drive. This allows you to show previously queried SWITRS data from TIMS on the map alongside any current queries. It also allows other types of crash data to be displayed at the same time as well.
To import point layers click on the Import Layers button and navigate to the appropriate file. There are currently two different ways to import a points layer:
SWITRS csv file from TIMS
If you have previously downloaded a csv file from any of the mapping applications on TIMS, then you can import it onto the map. An Imported Crashes window will display the total number of crashes mapped.
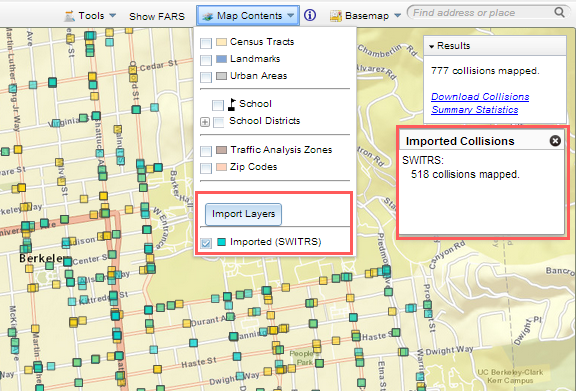 Imported crashes will be displayed as aqua-colored squares and can be interacted with in a similar manner as crashes displayed from the Map SWITRS panel. Click on a crash to view its crash details. After importing a layer, the Map Contents menu will update with check boxes so that those layers can be turned on/off.
Tip: A special drag and drop feature is only available for SWITRS csv files. This allows you to simply drag the csv file from your hard drive onto the map and display the crashes.
Shapefiles
Shapefiles can also be imported as layers. The shapefile components (*.shp, *.shx, *.sbn, *.sbx, *.dbf, *.prj) must be in a zip file (.zip). The zip file should then be selected in the Open window. The data fields will be shown in the pop-up window.
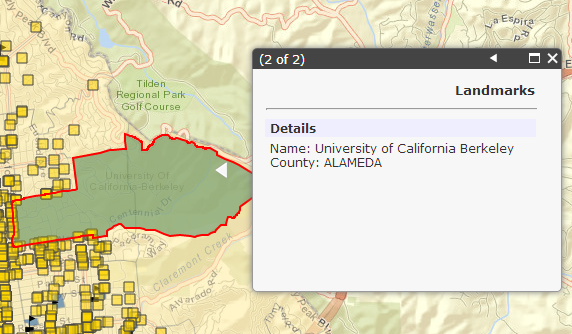
Identify
Use the Identify tool to learn more about a point or area that is currently displayed as a layer via Map Contents. First, make sure that the layer you are interested in is turned on. Then, activate the Identify function. Click on the map within one of the boundaries or on one of the individual symbols. A white triangle will show where you clicked on the map. If multiple layers are under that triangle, you can scroll through the layers using the arrows in the top corner of the pop-up window.
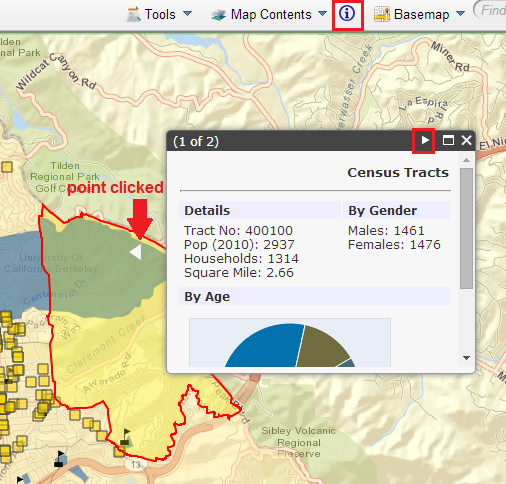
Note: The Identify function only works for 'Map Contents' layers, not crashes. To identify crashes, deactivate the Identify function by activating another tool or clicking the Deactivate tool.
Basemaps
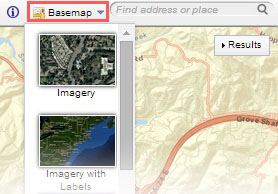 Switch to a basemap by clicking it from the Basemap dropdown menu. A basemap presents background referential information such as roads, landmarks, political boundaries, and landforms. The default basemap in the SWITRS GIS Map is Streets.
List of Basemaps
| Basemap | Description | |
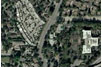 |
Imagery | High-resolution aerial imagery; no labels. |
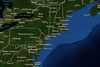 |
Imagery with Labels | Same as Imagery, but includes labels of major streets, institutions, cities, and other points. Depending on how zoomed in or out you are on the map, the number and placement of labels that is displayed will vary. |
 |
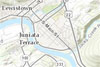
Streets (Default) | Comprehensive map with street-level data. Depending on how zoomed in or out you are on the map, the basemap can include street names, water features, and other physical/political/economic points of interest such as parks, schools, and hospitals. |
 |
Topographic | Detailed topographic map that shows and labels political boundaries, water features, parks, landmarks, buildings, transportation, and other features. |
 |
Terrain with Labels | Shaded relief map that shows the physical changes to the landscape. This basemap also displays primary streets, county lines, and rivers. |
 |
Light Gray Canvas | Minimalist map with neutral colors and minimal labels for major streets and points of interest. This basemap is useful when you do not want detailed street information (as with Streets and OpenStreetMap) to be distracting. |
 |
National Geographic | Shaded relief map that uses National Geographic's cartographic and typographic design. This basemap shows administrative boundaries, protected areas, streets, railways, highways, water features, buildings, and landmarks. |
 |
Oceans | Map that displays and labels water body features , undersea features, and some derived depth values in meters. |
 |
OpenStreetMap | Collaborative map that displays data collected via the OpenStreetsMap project. For some locations, this layer may be more updated than other street basemaps. |
Location Search Bar
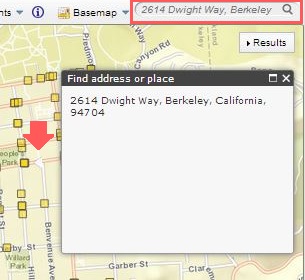 To find a location on the map, enter an intersection or address, including the city and state in the Location Search Bar in the main toolbar; next, click the Search icon or hit enter on the keyboard, and the map will zoom to that location. If an exact location cannot be found, it will zoom to the nearest identifiable location such as the street or city.
Similar to the Identify function, a white triangle will point to the address or intersection. A pop-up window will also display the address or location.
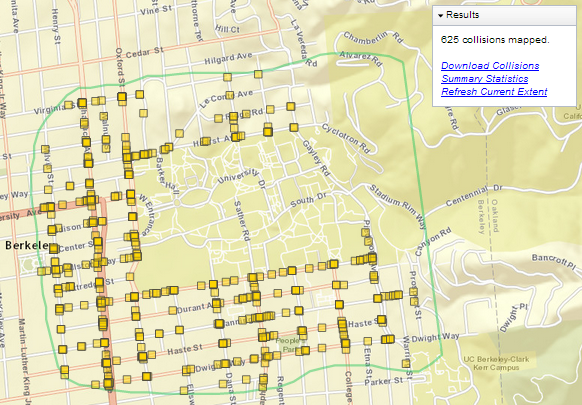
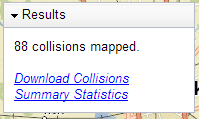 The Results box will show the summary status of the crashes that are displayed on the map. The box will state the number of crashes that have been mapped. Depending on the query different hyperlink functions will be shown in the box.
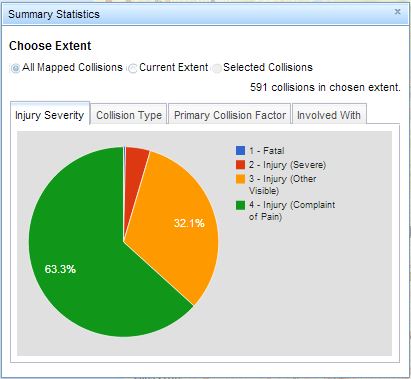 Clicking the Summary Statistics link in the Results box shows a pop-up chart and table summary of the mapped crashes. Users have the option to show summaries for All Mapped Crashes, only crashes in the Current Extent, or only Selected Crashes. In each case, the crashes count and the tabs for Injury Severity, Type of Crash, Primary Crash Factor, and Involved With update accordingly. The charts can be captured in a screenshot and the tables can be copied directly for quick visuals to include in a presentation or document.
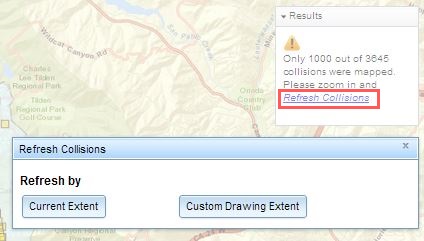
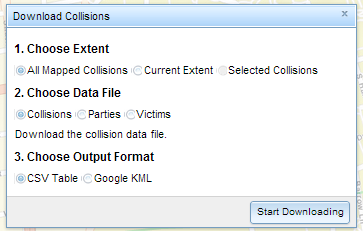 Clicking the Download Crashes link in the Results box shows a pop-up window with several options.