Introduction
The tool can be used to assist state and local Metropolitan Planning Organizations (MPOs) to set safety performance targets that are required by the FHWA Safety PM Final Rule and support the Highway Safety Improvement Program (HSIP). Users can select one of five performance measures and map it by MPO, County or City to generate a summary. This summary can be used to identify trends and assess progress towards achieving safety performance targets in the selected jurisdiction. Information and data generated can also be used by MPOs to inform transportation planning, programming decision-making, and the allocation of resources that result in the reduction of fatalities and serious injuries.
To use this tool, click on California Safety PM from the Tools dropdown menu.
Data used for this tool:
- Nationwide Fatality Analysis Reporting System (FARS) data is used for fatality.
- California Statewide Integrated Traffic Records System (SWITRS) data is used for fatalities and serious injuries.
- Statistical information derived from the Highway Performance Monitoring System (HPMS) from California Public Road Data is used for traffic volume data.
1. California Statewide Map
The statewide heatmap visualizes the performance measures for each county. Users select from the five performance measure to map:
- Number of Fatalities
- Rate of Fatalities per 100 million Vehicle Miles Traveled (VMT)
- Number of Serious Injuries
- Rate of Serious Injuries per 100 million VMT
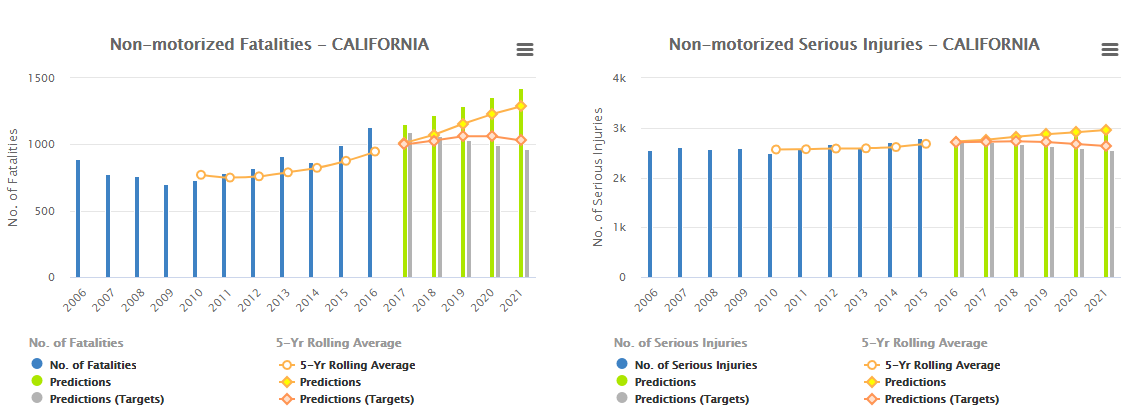
- Number of Non-motorized Fatalities and Non-motorized Serious Injuries

For more information on the five performance measures, please visit the FHWA Safety Performance Management website at: https://safety.fhwa.dot.gov/hsip/spm/
Users have the option of choosing whether to use provisional SWITRS data. The default is to include all available data. For more information on provisional data, please visit our SWITRS help doc at: https://tims.berkeley.edu/help/SWITRS.php#Final_Provisional

The default heat map visualizes the number of fatalities, which is the first performance measure.
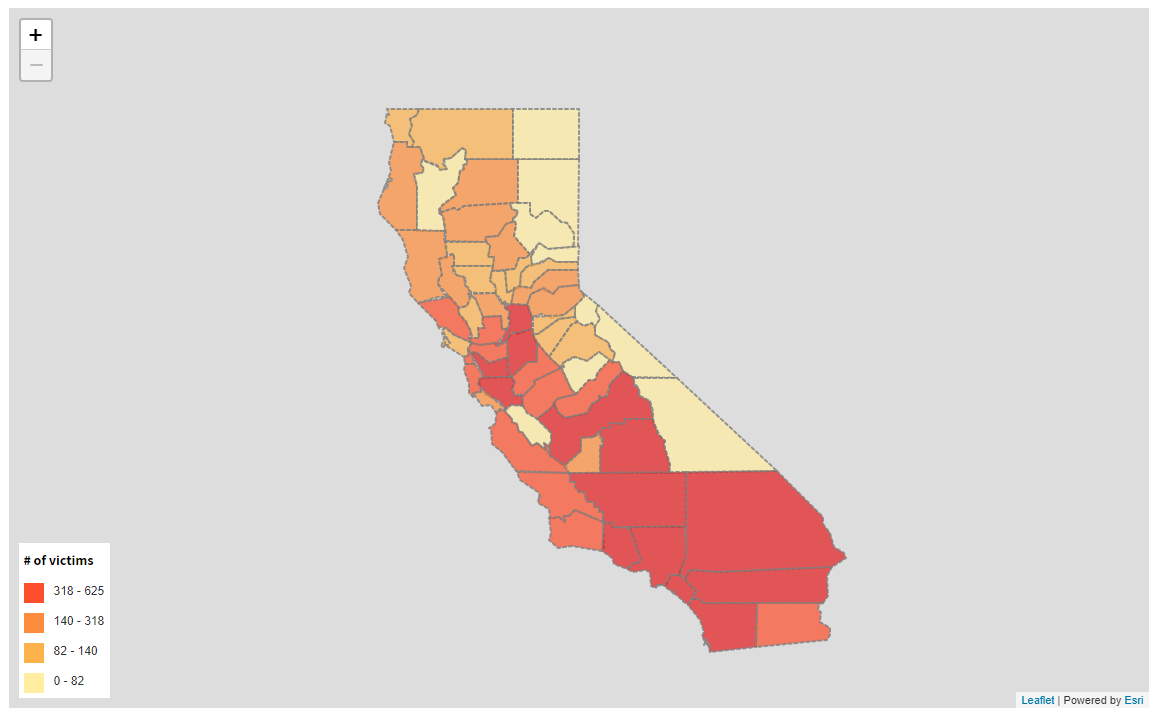
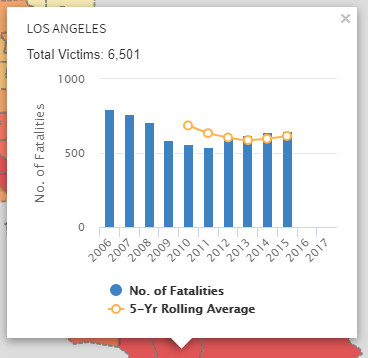
When you click on a county, a popup will show yearly trends with all available data. In addition, five-year rolling averages will also be shown as an orange trend line.
2. MPO, County or City Summary
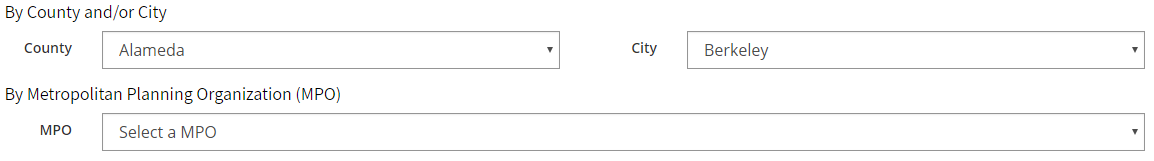
In this step, users select a County/City/MPO to create charts for the five performance measures.
- County
- City
- For the entire county, users should select "Show Countywide".
- For only the crashes within the County's jurisdiction, users should select "Unincorporated".
- Metropolitan Planning Organization (MPO)
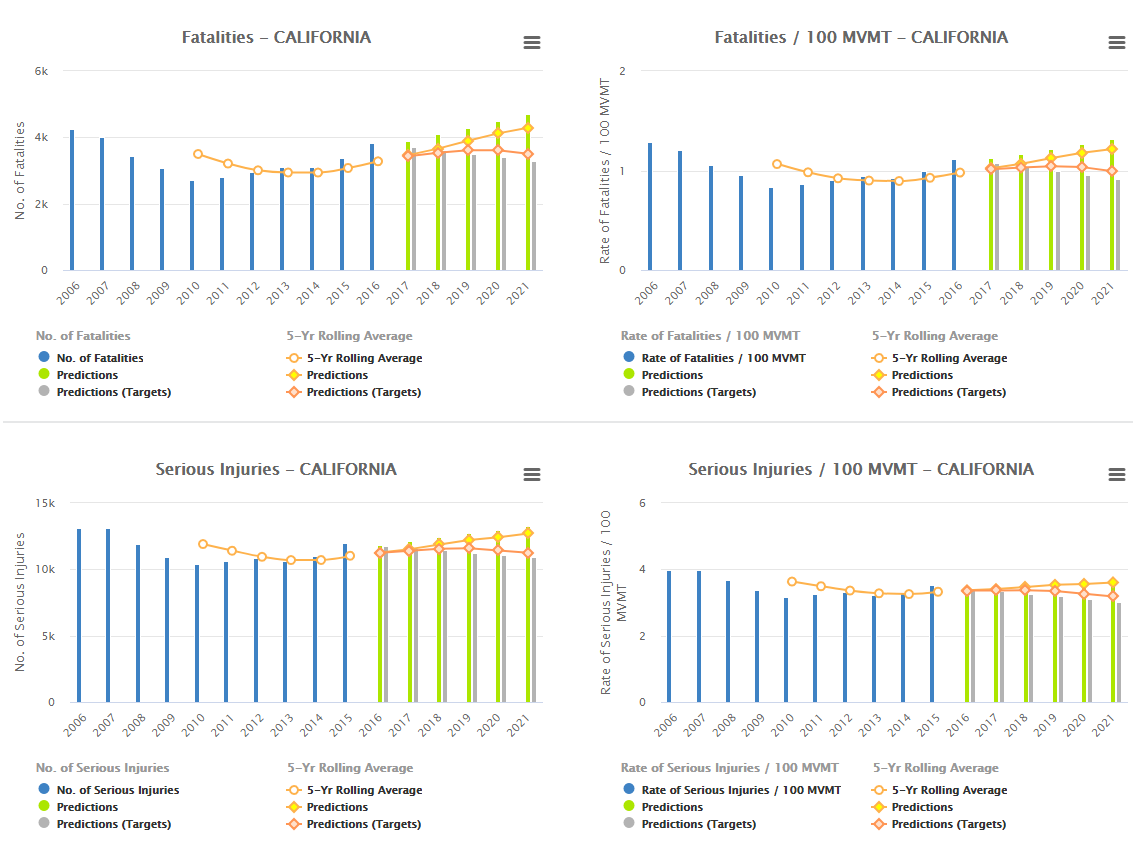
Users can choose to include projected data in the chart.
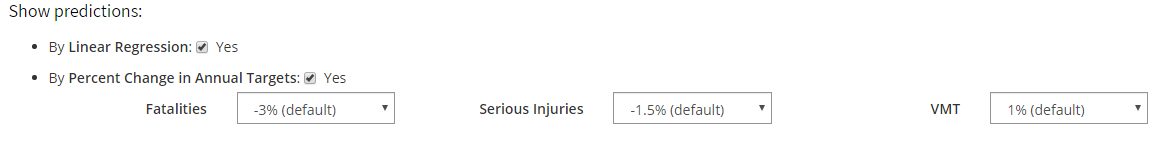
There are two prediction options. The first one is based on a linear regression model, and the second one is based on targeted percentage change. Users can choose to include either one of the predictions or both.
Explanation of the Prediction:
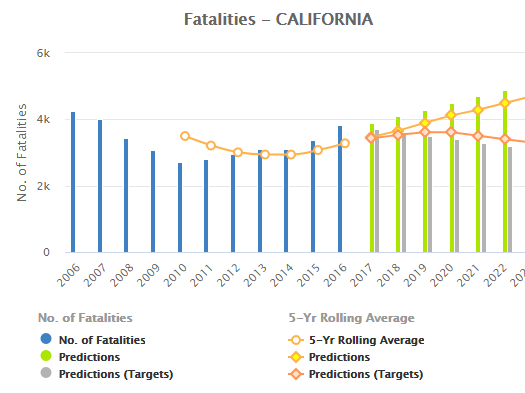
- Fatality/serious injury prediction in green bars is based on the latest five year available data. A linear regression model is used to determine projected data.
- 5-Yr rolling average prediction is calculated by both available data and fatality/serious injury predictions.
- Performance Measure target prediction default values are determined by the Caltrans Safety Performance Management Targets. More resources can be found at http://www.dot.ca.gov/fed-liaison/.
Summary Results
Summary result chart of the five performance measures for the selected area will be shown here.