Introduction
The Crash Diagram tool allows users to generate an interactive crash diagram. To access the tool, select a set of crashes in SWITRS GIS Map (for help in spatially selecting crashes, see here). Next, click on the link to Create Crash Diagram that should now be included in the Results box. This user guide will go over the Crash Diagram tool's features as well as a step-by-step tutorial.

Page Layout
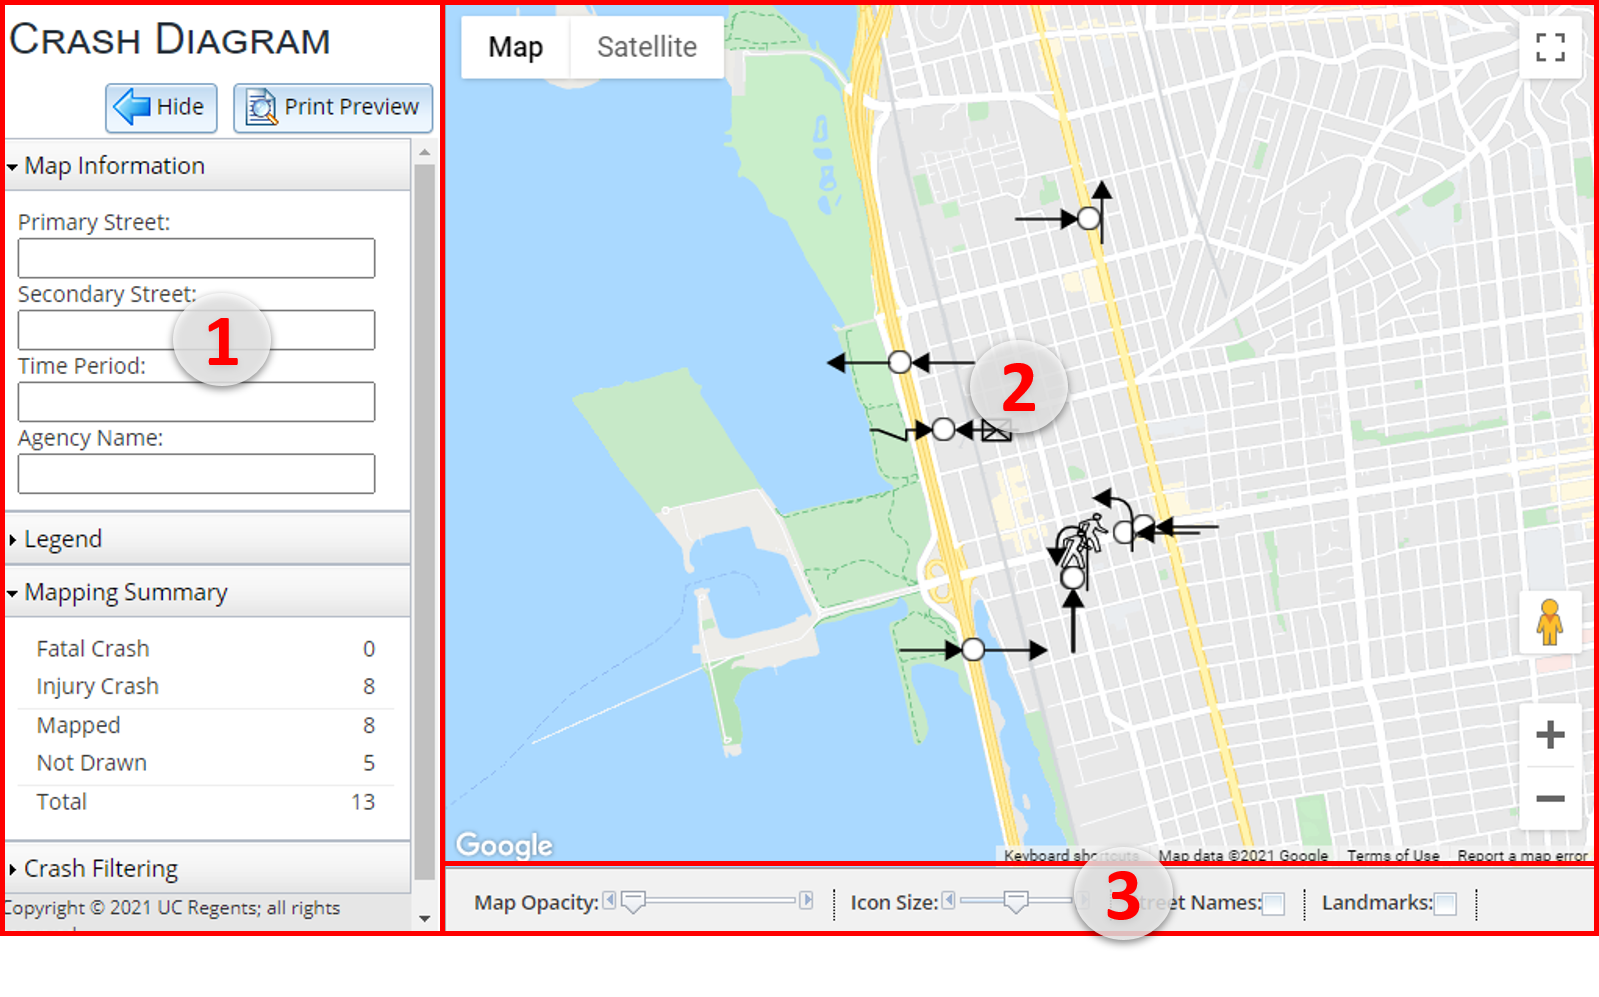
1. Crash Diagram Information Panel
The Crash Diagram Information Panel is located on the left side of the window. This panel can be minimized by clicking the Hide button near the top. To unhide the panel, click Show Menu in the toolbar on the left. This panel contains Map Information (expanded by default), a Legend, a Mapping Summary, and Crash Filtering. Click on a title bar to expand or collapse its menu. You can also Print Preview the crash diagram, and from the subsequent page, Print the diagram.
2. Map
The Map is the main pane of the Crash Diagram tool. This is where the crash symbols and other layers are displayed. The map can be maximized by hiding the Crash Diagram Information panel.
3. Map Toolbar
Use the Map Toolbar at the bottom of the window to customize the appearance of the map. You can adjust the map opacity and icon size; you can also toggle the street names, landmarks and grayscale for the map background.
1. Crash Diagram Panel
Print Preview
If you want to print the diagram, click the Print Preview button in the top-right corner of the information panel.

The print preview window is preset to a regular 8.5 x 11 inch portrait view. The map information, mapping summary, and legend are displayed at the top of the page. The map shows the symbols for the crashes you had selected. You can also adjust the map view by panning and zooming in/out on the map. To go back to the Crash Diagram tool, click on the Exit Print Preview button. Otherwise, you can now Print the page.
Map Information
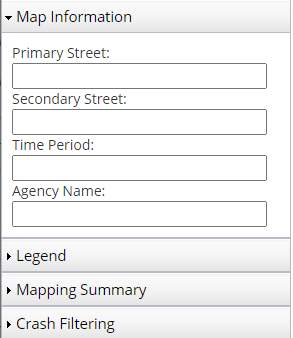 In Map Information, you can enter information about the location, time period, and agency in their respected text fields. These will be included in the print-out.
Legend
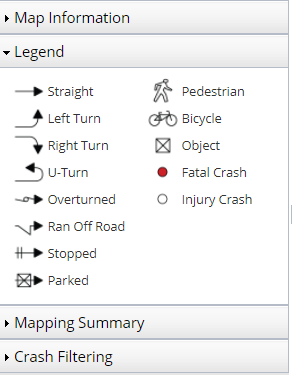 The Legend is a key to all of the symbols used on the map. The symbols on the legend's left side represent a vehicle's movement (or non-movement). On the right are the symbols for pedestrians, bicycles, objects (trees, light poles, etc.), and crashes.
Mapping Summary
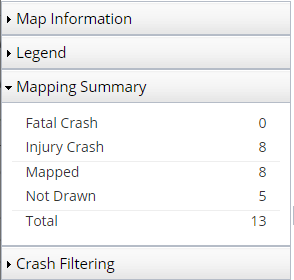 The Mapping Summary shows how many of the mapped crashes are Fatal vs. Injury. It also shows the Total number of crashes that were selected (from the SWITRS GIS Map) and the number of these crashes that are Mapped vs. Not Drawn. Crashes are not drawn when there are more than 2 parties involved and/or when parties' movements are not valid (e.g., a crash between two parked cars).
Crash Filtering
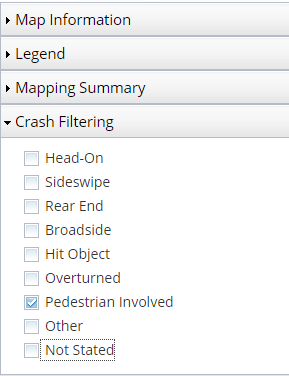 Customize the type of crashes to be shown by checking/unchecking the crash types in the Crash Filtering menu.
2. Map
In addition to mapping and filtering the crashes that were selected from the SWTRS GIS Map tool, you can also add crashes that were not geocoded or included in the SWITRS database directly onto the map.
Add Crash
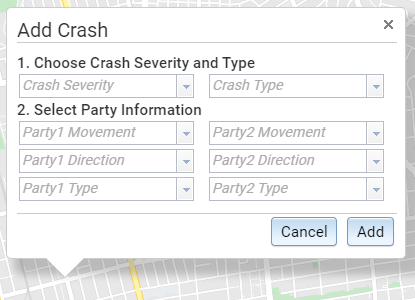 Right-click on a location on the map to add a new crash. In the Add Crash pop-up window, select from the drop-down list of valid options for each type of crash information (Crash Severity, Crash Type, and Party information). Click Add to finish. The new symbol/crash will appear on the map.
Edit Crash
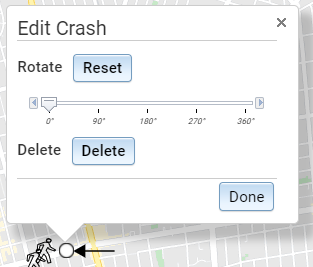 Right-click on a crash symbol (a white or red dot) to rotate or delete the crash from the map. If a crash is deleted, the map summary counts will automatically be updated.
Move a Crash
To move a crash, click on the crash symbol (a white or red dot) and hold and drag it to its new preferred location.
Crash Details
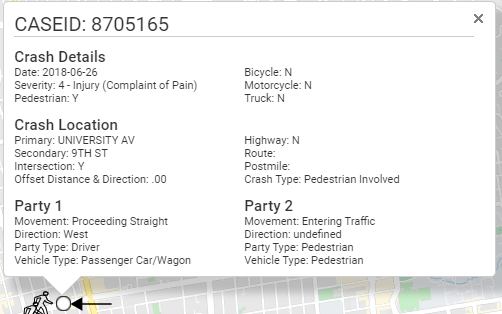 Click on a crash to open its Crash Details pop-up window. Details include the crash's CaseID, general crash details, crash location, and party information.
3. Map Toolbar
The Map Toolbar lets you edit the appearance of the map and symbols. All functions are available when Map is selected as the basemap. When the Satellite map is used as the basemap, only Map Opacity and Icon Size are available. You can switch between the Map or Satellite basemaps by selecting the preferred basemap on the top right of the map.
Map Opacity
The Map Opacity control bar allows the map background's transparency level to be adjusted. It is especially useful when the Satellite basemap is on; symbols show up more clearly when the map background is more transparent.
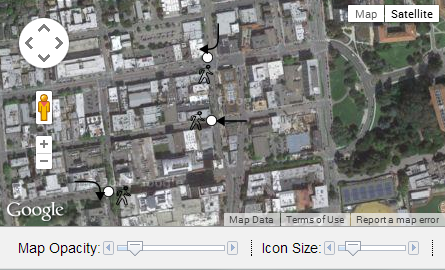
Before: Map Opacity ≈ 15%
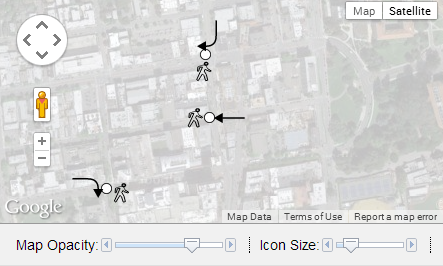
After: Map Opacity ≈ 75%
Icon Size
The Icon Size control bar allows you to change the size of all the symbols displayed on the map.
Street Names
When using the Map basemap, you can choose to show/not show the Street Names by checking/unchecking this checkbox.
Landmarks
When using the Map basemap, you can choose to show/not show Landmarks by checking/unchecking this checkbox.
Grayscale
When using the Map basemap, you can choose to show the map in colors or black and white by checking/unchecking the Grayscale checkbox.
4. Tutorial
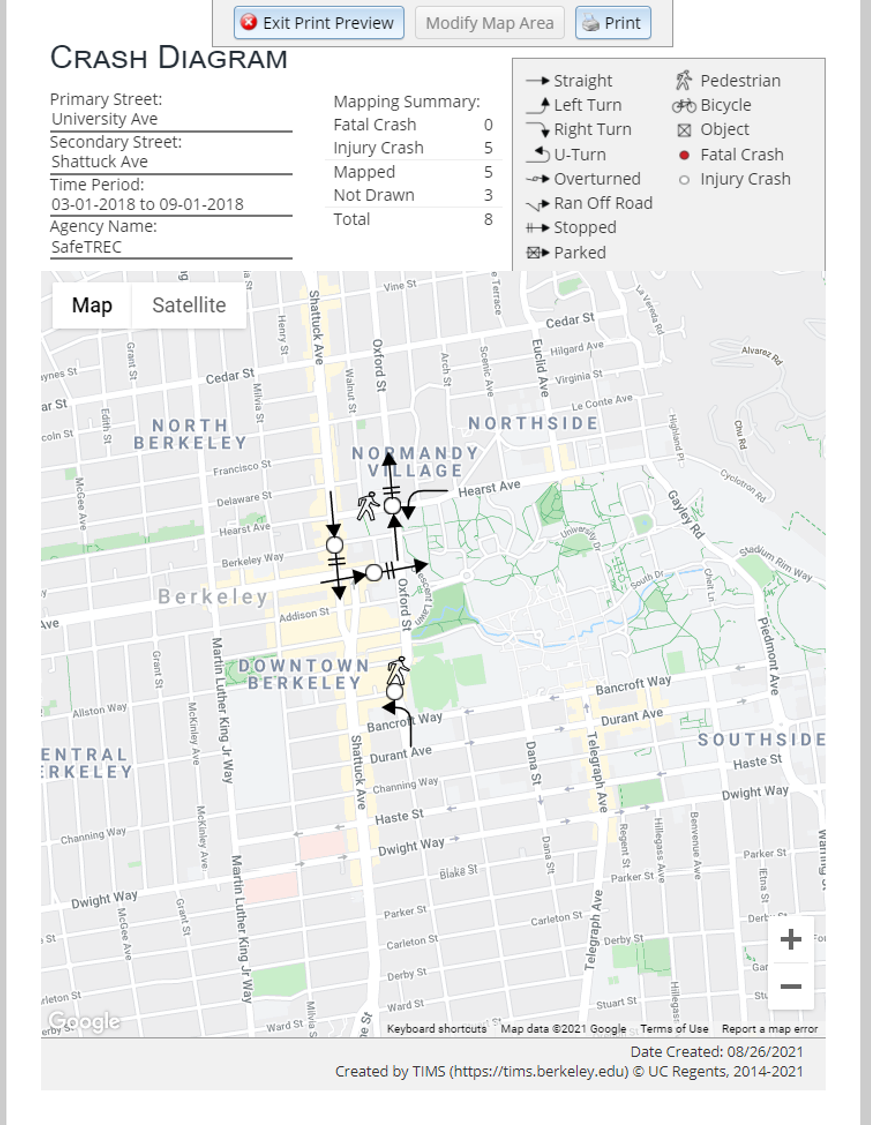
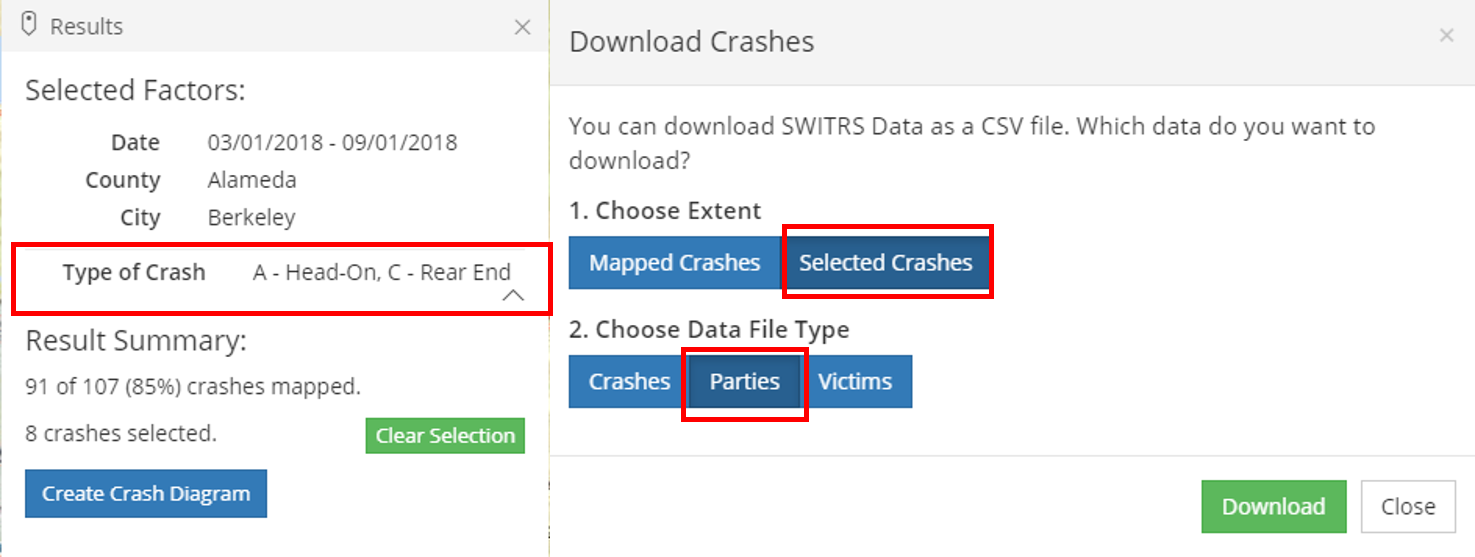
Task: Create a crash diagram for the area around the intersection of University Avenue and Shattuck Avenue in Berkeley, California. Focus only on head-on and rear-end crashes between cars that were proceeding straight before crashing.
1. Input parameters into SWITRS GIS Map.
In the SWITRS GIS Map tool, query the following customized conditions. (If you have not used the SWITRS GIS Map before, click here for the user guide.)
- Time Frame: 03-01-2018 to 09-01-2018
- County: Alameda
- City: Berkeley
- Crash Factor: Type of Crash = 'Head-On' and 'Rear End'
- Party Factor: Movement Preceding Crash = 'Proceeding Straight'
- Victim Factor: Party Number = '0 to 2'
2. Spatially select the crashes of interest.
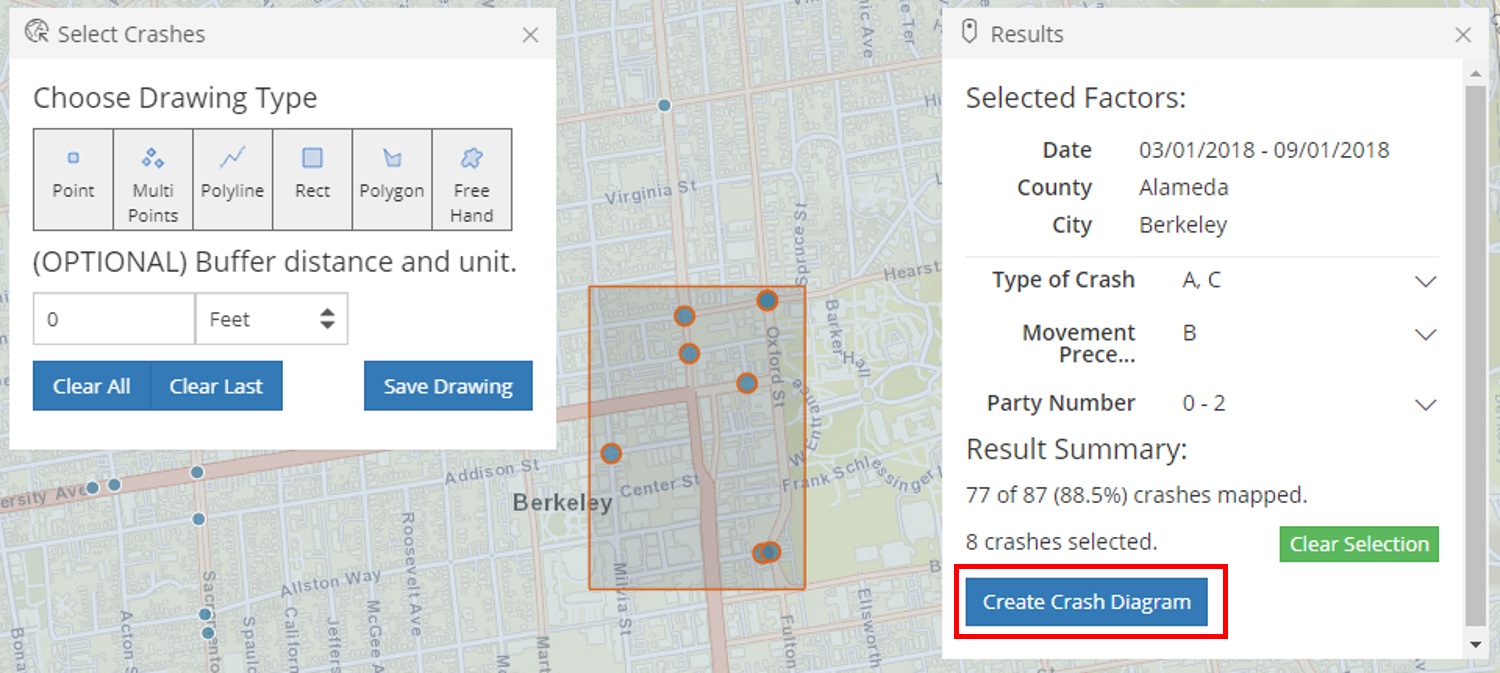 In this example, select the 8 crashes around the intersection of University Avenue and Shattuck Avenue. Then, click Create Crash Diagram in the Results box.
3. Fill out map information.
In the Crash Diagram panel's Map Information, type in the following details in the corresponding fields.
- Primary Street: University Ave
- Secondary Street: Shattuck Ave
- Time Period: 03-01-2018 to 09-01-2018
- Agency Name: SafeTREC
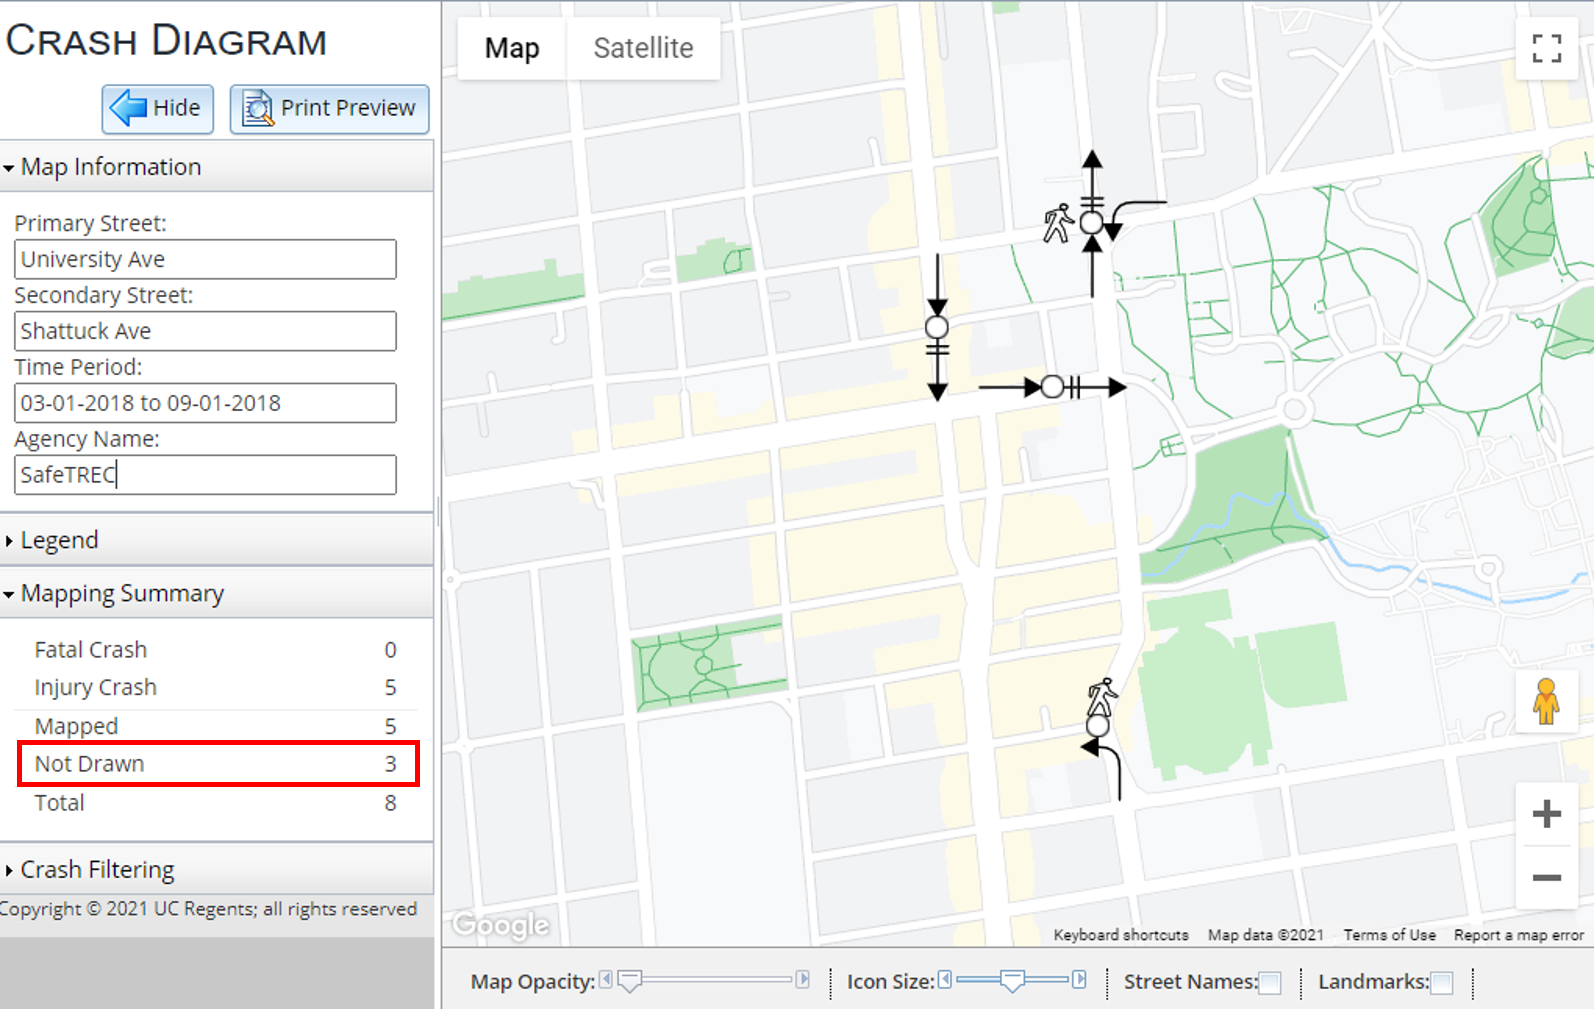 Note the 3 unmapped crashes in the Mapping Summary. From here, you can choose to either print this crash diagram as it is or add/edit crashes. The next section covers steps that you can take to further improve your crash diagram.
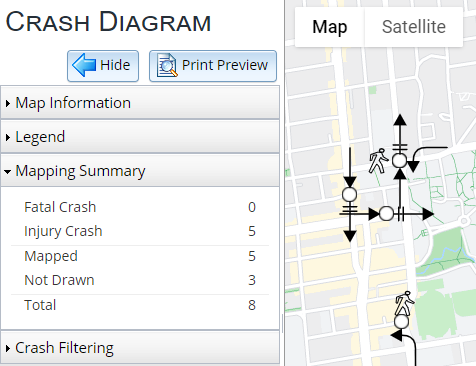
4. Check for overlapped crashes.
Crashes can overlap if they occur in the same location at different times. To find such clusters, look for areas where there's only one crash symbol surrounded by multiple arrows, pedestrians, or bicycles. After identifying these clusters, follow the next step to adjust their locations.
Note: Compare the number of crashes symbols to the mapped crash count (4 vs. 5, respectively). Crashes here are overlapped.
5. Adjust the location of each crash.
To better investigate the environmental factors causing the crashes, relocate crashes to their more accurate and reasonable positions, such as in a specific lane or crosswalk. Without the original crash report, however, the location accuracy will always be somewhat limited.
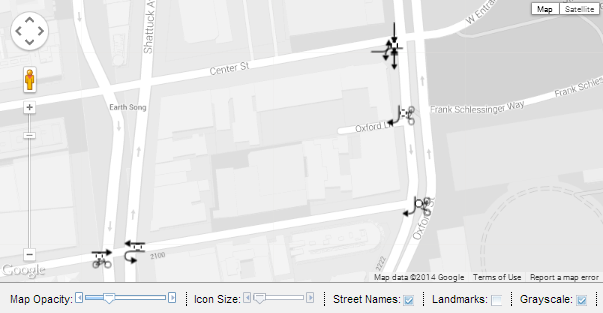
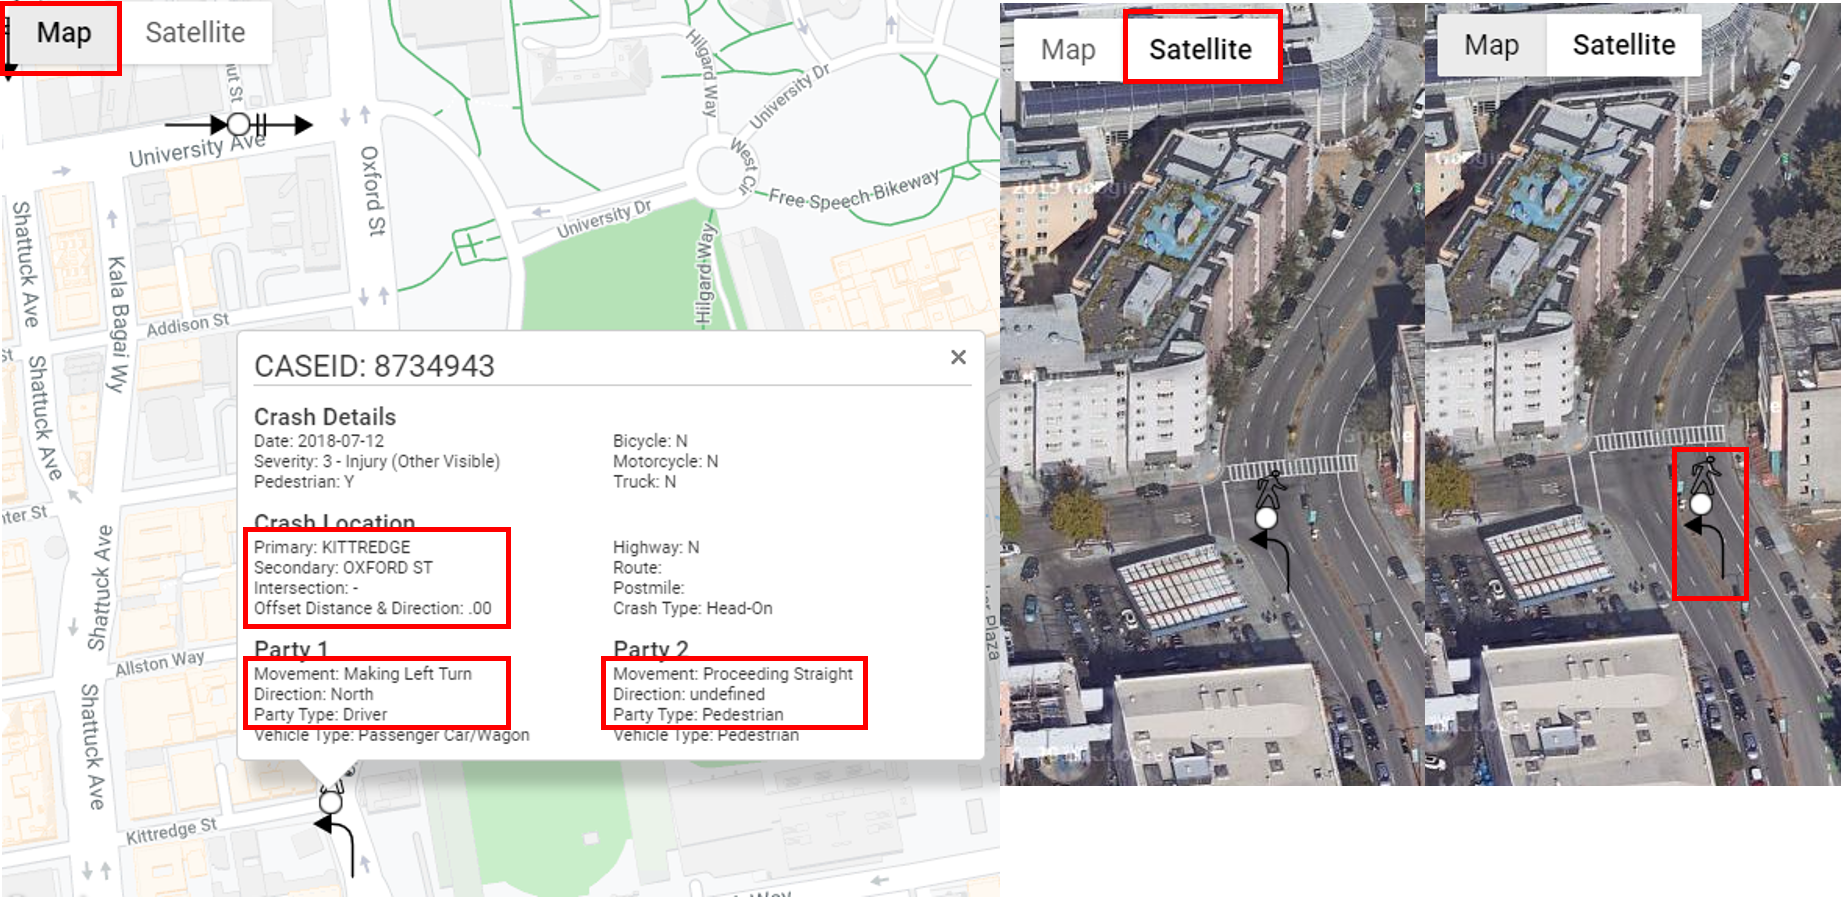
Example: Crash at intersection of Kittredge Street and Oxford Street
- Toggle on Street Names in the Map Toolbar so that you know where the primary and secondary streets of the location are.
- Click on the crash symbol to open up its Crash Details dialogue window. Note that the vehicle was heading north on Oxford St. before making a left turn to Kittredge Street. The pedestrian was proceeding straight.
- Switch to the Satellite basemap for striping details and adjust the Map Opacity as needed; this will help you relocate the crash to the appropriate lane
- Click on the crash symbol and drag and drop it to its new location.From the Crash Details, we now know that the crash should be moved to left-turning lane on Oxford St.
6. Rotate the crash to fit the direction of the traffic.
In many cases, traffic flow is not completely horizontal or vertical on the map. Crash symbols can be rotated to match the traffic flow direction or the driving lane.
Example: Crash at intersection of University Avenue and Walnut Street
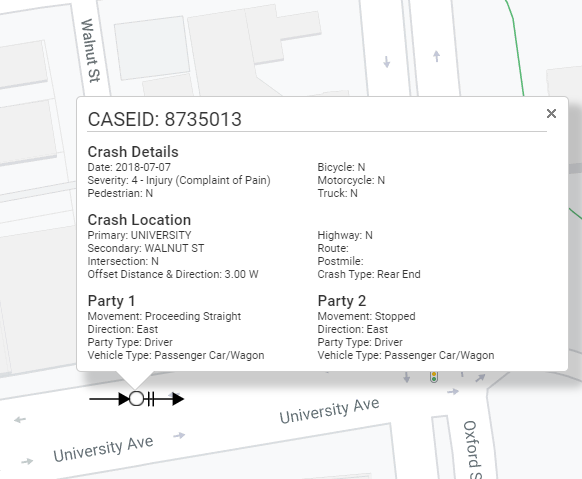 Click on the crash symbol to open up its Crash Details. Verify that the arrow is pointing the correct direction.
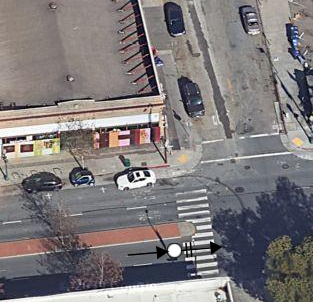 Move the crash to the eastbound lane on University Ave. The crash should be slightly left of the intersection since the offset distance and direction is 3 W, as noted in Crash Details.
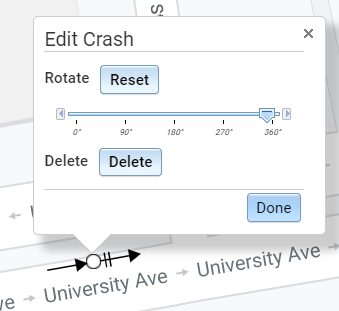 Adjust the arrow's rotation. Right-click on the crash symbol and adjust its rotation until the vehicle symbol matches the lane direction and angle.
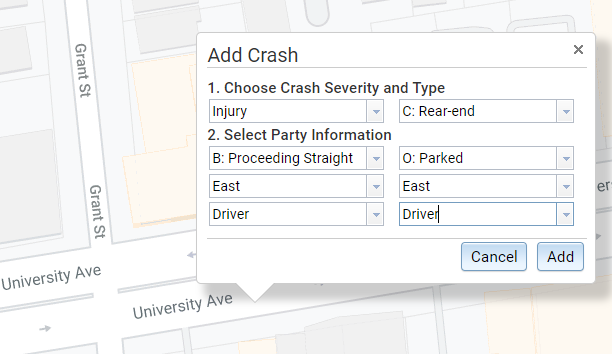
7. Add an undrawn crash.
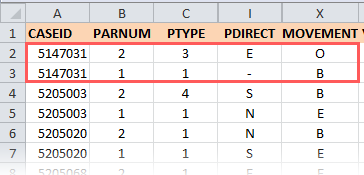
- Before adding undrawn crashes, first determine which crashes were 'not drawn'. Go back to the SWITRS GIS Map tool and download the crashes data file for the selected crashes.
- Compare the CaseIDs in the crashes spreadsheet with the crash information in the diagram to find the undrawn crash. In this example, the undrawn crash is crash #5147031.
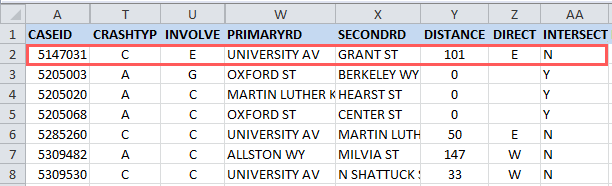
- Next, go back to SWITRS GIS Map tool and download the parties file; make sure to remove the party and victim factors—you will want all associated parties with the selected crashes, and not just the ones that were 'proceeding straight'.
-
 Collect the required information to add a new crash on the map. Use the codebooks for the crashes and party data files to translate to the following information:
Crash severity: Injury
Crash type: Rear end
Party 1 movement: Proceeding straight Party 2 movement: Parked Party 1 direction: Unknown Party 2 direction: East Party 1 type: Driver Party 2 type: Parked vehicle - Analyze the collected data. From the above data, you can see that the lack of direction information for Party 1 is why the crash was not drawn in the crash diagram. However, since you now know that the crash type was a rear-end and that the parked vehicle (Party 2) was facing east when it was hit from behind by Party 1, you can judge that the direction for both parties should be the same. Thus, Party 1 direction should also be East.
- Add the crash manually. Make sure to account for the crash's offset distance and the offset direction from the intersection. In this example, the crash should be a little right (101 feet East) of the intersection of University Ave and Grant St.
8. Print.
Check the print preview, zoom in or out to include all the crashes you want in the map window, and click Print when you're ready. You can also save it as a PDF by right-clicking (outside of the map) on the page and printing to a PDF printer.
Here is a print preview of the 8 crashes moved and rotated to their more accurate locations and orientations.