Introduction
The SWITRS GIS Map offers an interactive map-centric approach to viewing and querying SWITRS crash data. To use this tool, click on SWITRS GIS Map from the Tools dropdown menu. This user guide provides instructions on how to use the tool's many different functions.
Web Browser Compatibility
The SWITRS GIS Map is designed to run in many different web browsers. For optimal viewing experience and full functionality, we recommend the latest versions of Internet Explorer, Mozilla Firefox, or Google Chrome.
Page Layout
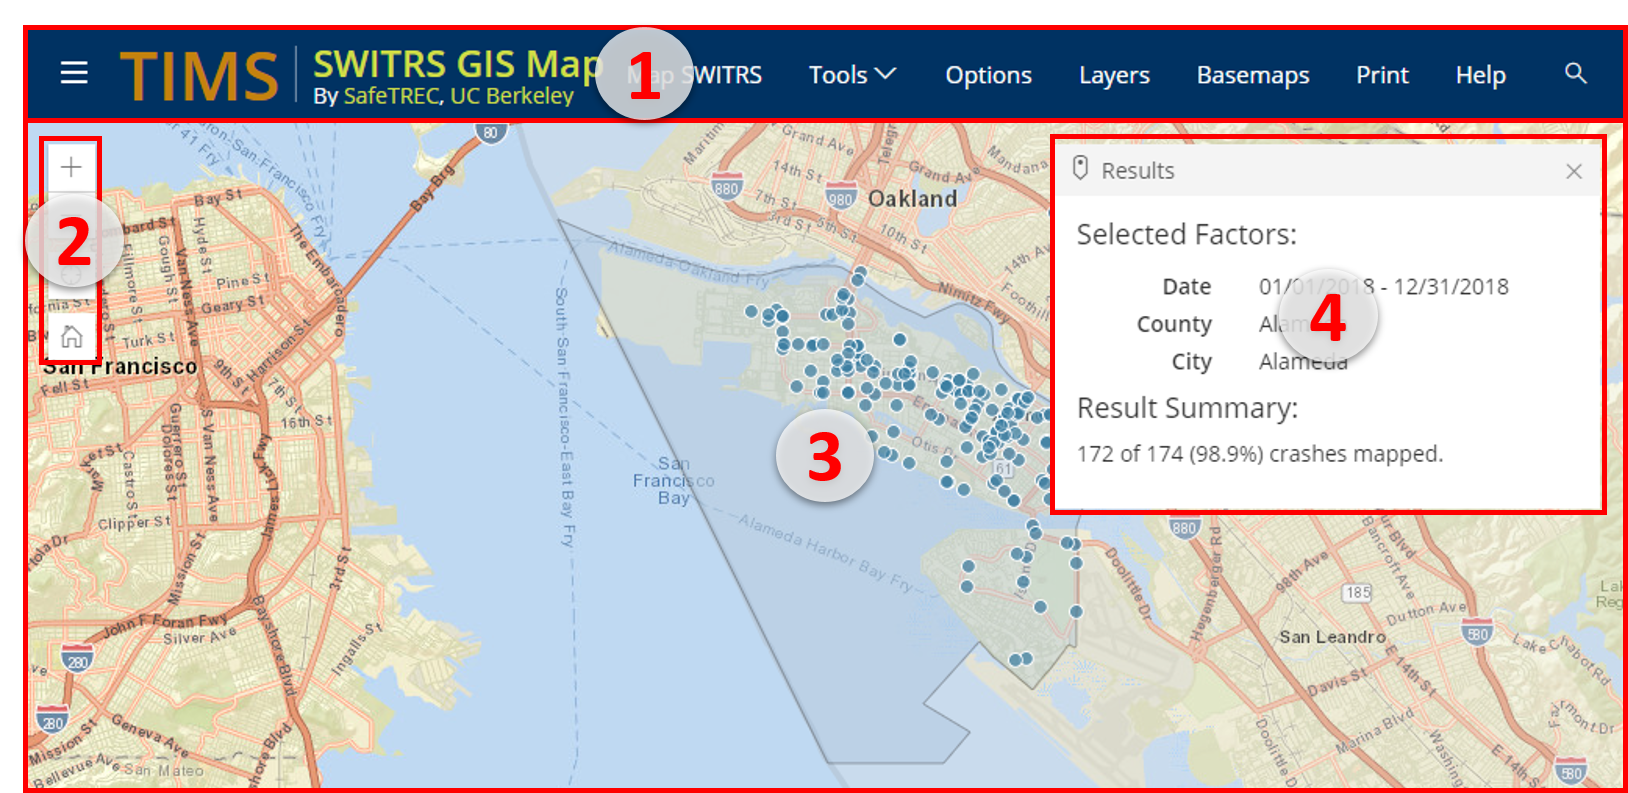
Toolbar
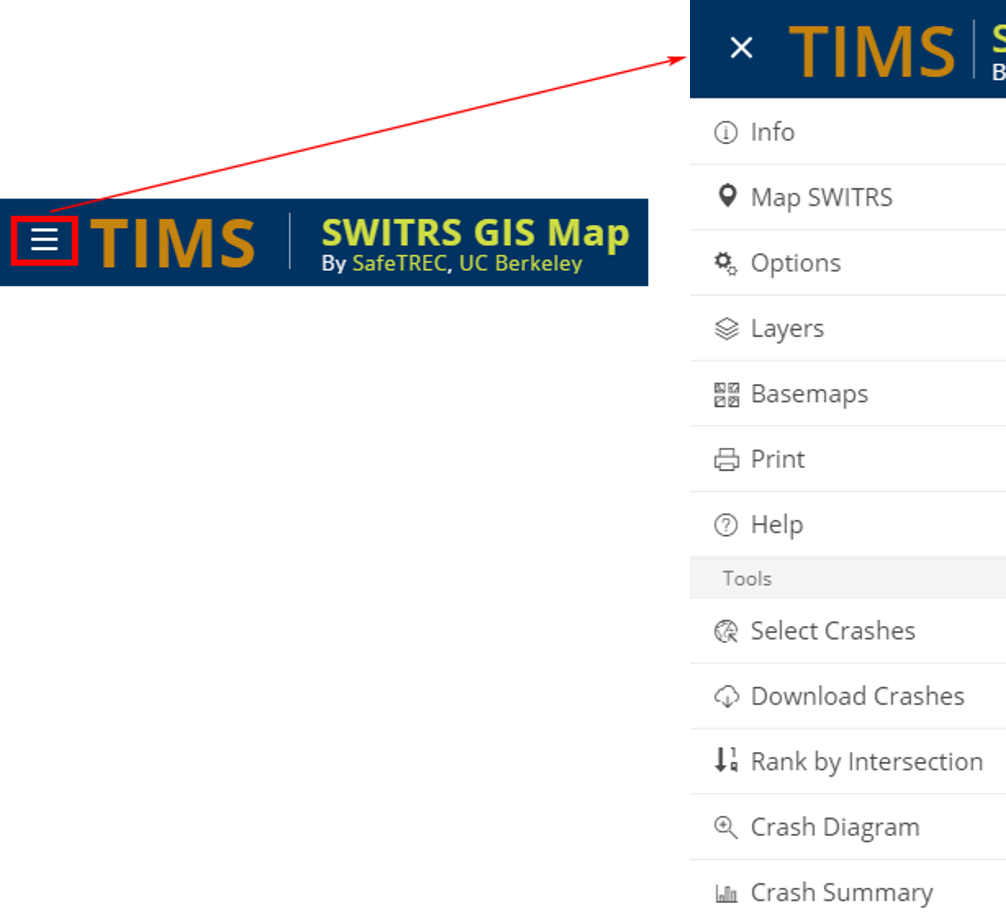
The Map SWITRS panel, tools, map contents, basemaps, and location search bar are located in the horizontal bar across the top of the map. All the functions to query SWITRS can be found by clicking Map SWITRS.
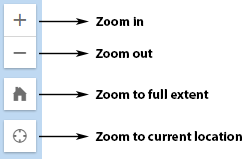
Navigation Toolbar
The navigation toolbar is located towards the top left. It provides several options for navigating the map.
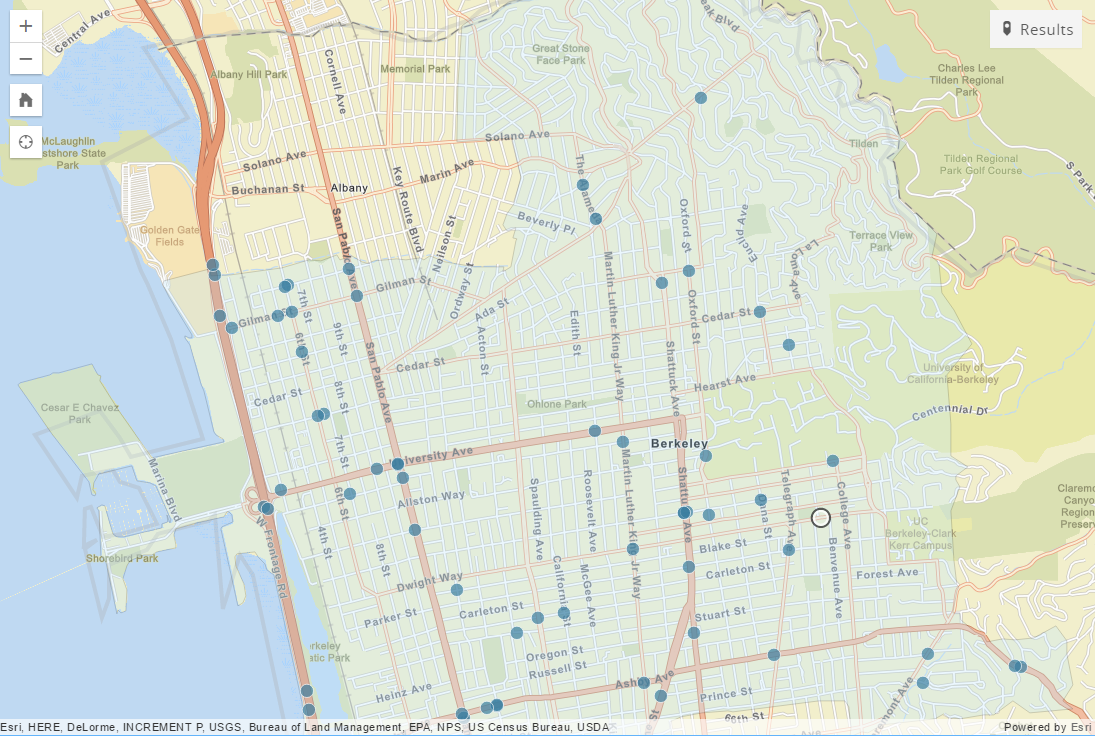
Map
The Map is the main component of the application; it is where crashes and other data layers are displayed. Other windows can be minimized to maximize the map extent.
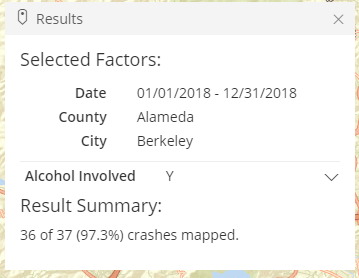
Results
The results window is shown hovering over the map in the top right. After showing crashes on the map it will automatically expand to summarize the results and give several options to interact with the data. It will also notify users when the crash display limit has been exceeded.
1. Toolbar - Map SWITRS
The core functionality of the SWITRS GIS Map is the ability to query and dynamically map the crash data. Many options are available in the Map SWITRS panel.
Date and Location Parameters
Users must first establish a time frame and location. The To and From dates can be selected from a calendar or typed into the Date box. The ten most current years of data are available to query. Note that the most current year available may be a provisional set and only a portion of the final crash records that will eventually be available. Please refer to the FAQs for more information.
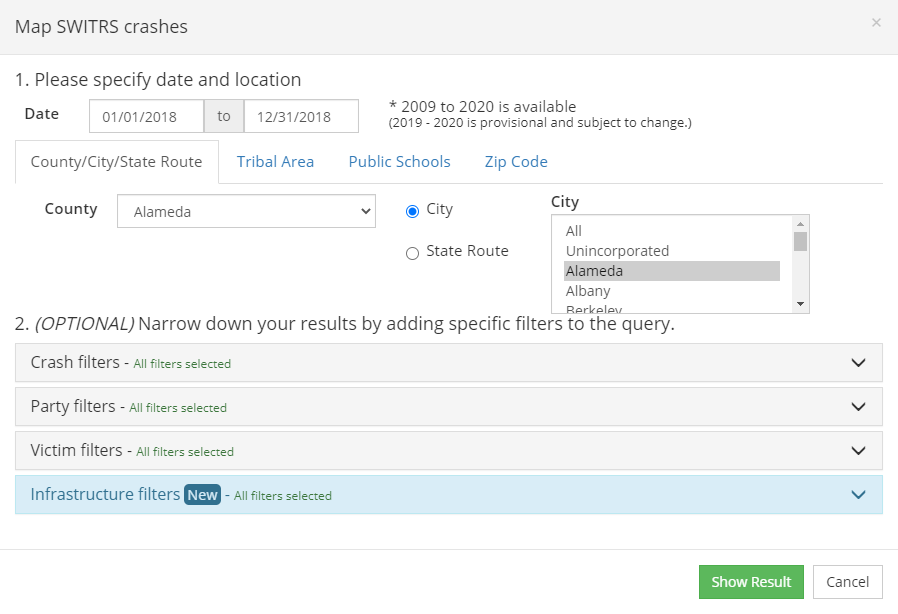
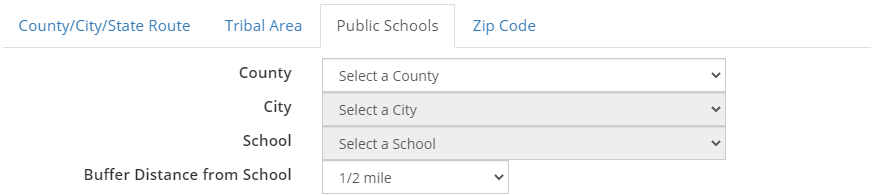
Four location types can be mapped from the tool: city/county/state route, tribal areas, public schools, and zip codes. If tribal areas or public schools are chosen, aside from mapping crashes within the selected location, there's also an option to view data within a buffered distance from 1/4 mile to 5 miles.
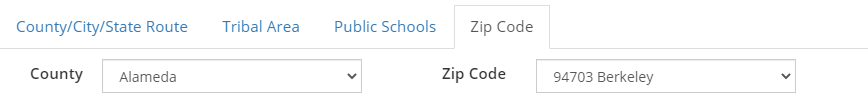
Select Zip Code
User can query from five-digit ZIP Code areas. Start by choosing the county then browse through the zip codes within the county.
Zip code boundary data used in this tool is acquired and maintained by Esri demographics. For more information, please see Esri USA ZIP Code Areas Description.
Select State Highway
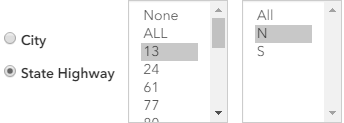 Choosing State Highway (and by default, ALL state highways and ALL directions) will show only crashes associated with the state highway. You can also select a specific state route number and its direction. Otherwise, all state routes in the county/city will be included. Choosing None will only show crashes not associated with the state highway system.
Select Crash/Party/Victim/Infrastructure Filters
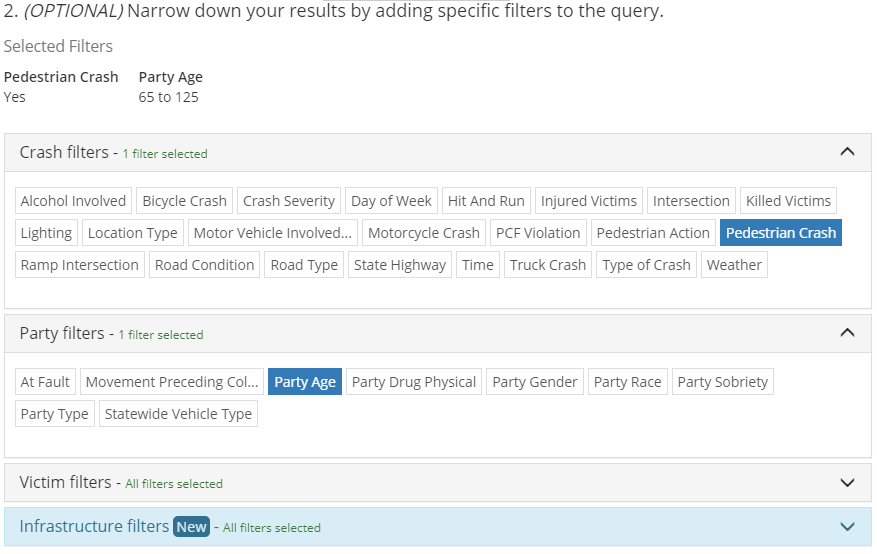
Next, users have the ability to select specific types of crashes based on crash, party, victim or infrastructure specific factors. For example, pedestrian crashes involving older adults could be specified by choosing Pedestrian Crash > Yes in the crash factors and specifying in the victim factors, Victim Age > 65 to 125. Filters that have been selected will appear in the middle of the screen. When a filter is hovered over, an x button will appear which will delete that specific filter when pressed.
At this time, only Functional Classification for infrastructure factor is available. To learn more about functional classification, please visit our SWITRS help page.
Refer to the codebook for more information regarding the fields. Only the most commonly used fields are available to query by in the SWITRS GIS Map tool. The Resources page also gives you more information about Working with the relational database structure that SWITRS data is organized in.
Identify Crashes/Crash Details
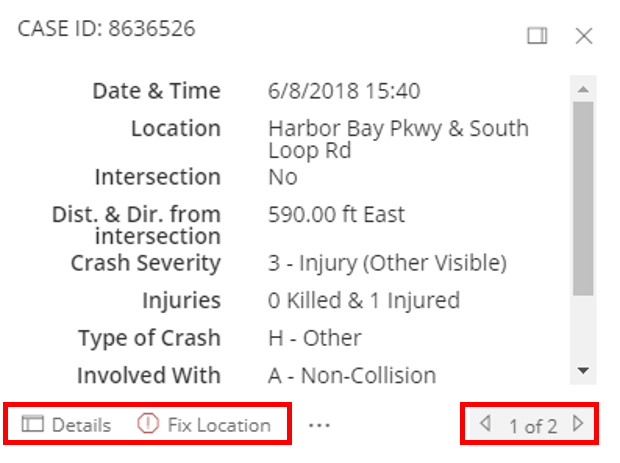 Once the crashes are displayed on the map, you can click on them to get more details. A pop-up will show details about the crash and location. If there is more than one crash in the same location, you will see x of total number of crashes in the bottom right of the dialog. To navigate through the different crashes, click on the small arrows. There are also two options across the bottom of the pop-up.
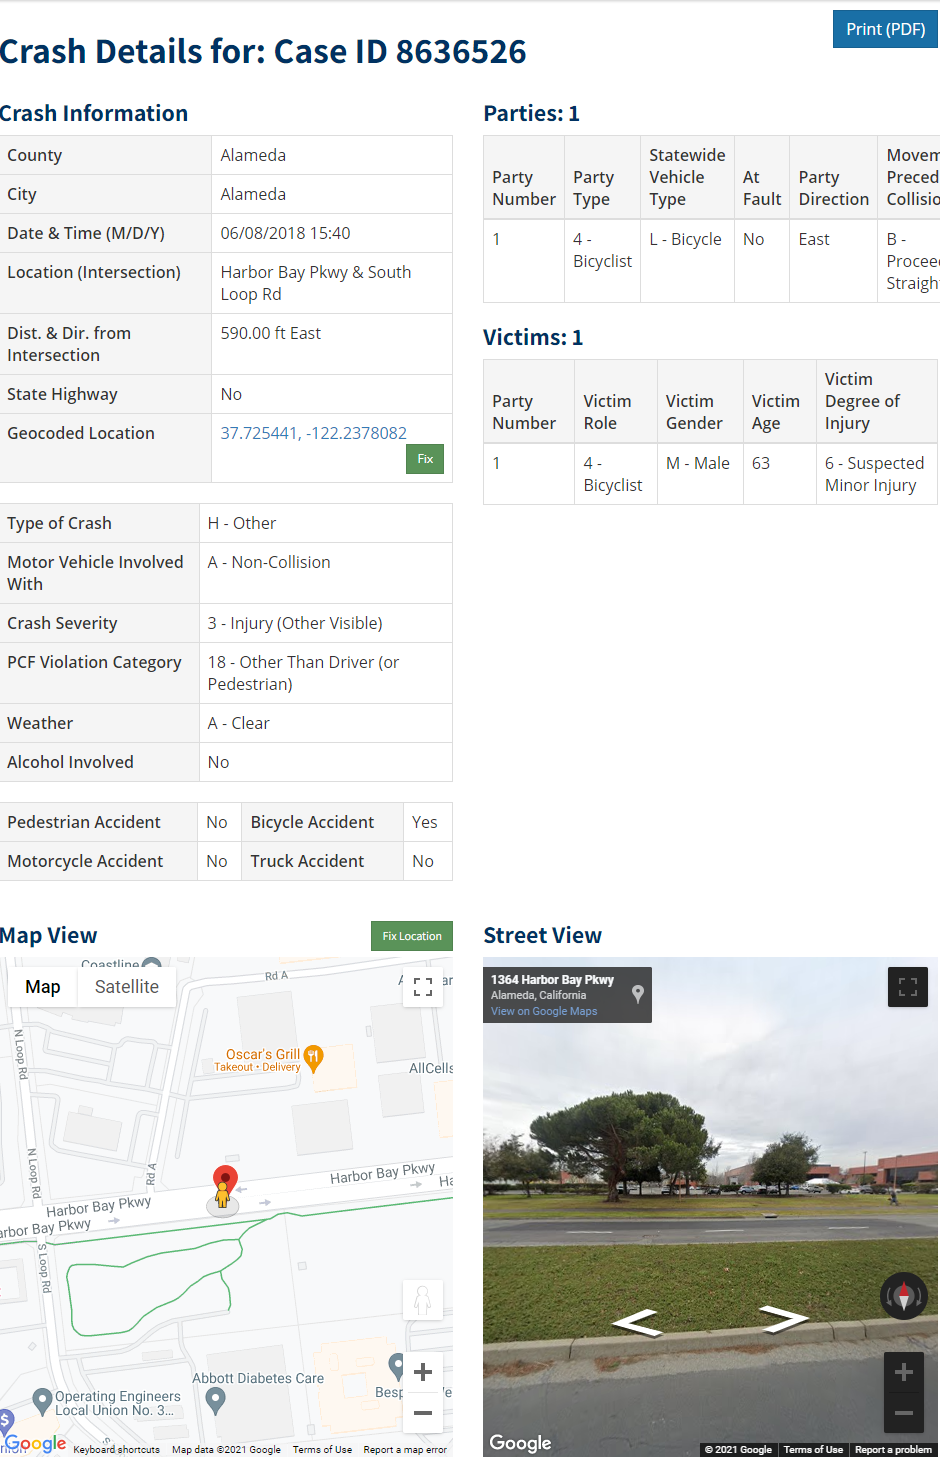
- Details: Opens a new page with a small map, the basic details, and a Google Street View; this page provides an easily printable 1 page summary of the crash.
- Fix Location: Opens a new page to report crash location errors.
Other toolbar features
Tools
The SWITRS GIS Tools can be accessed from the toolbar across the top of the map.
Spatially Select Crashes
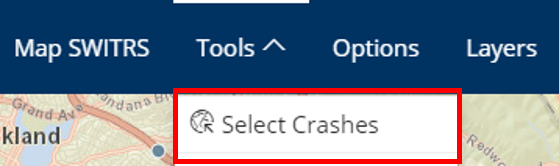 One of the most powerful features of SWITRS GIS Map is the ability to Select Crashes of interest in a region, corridor or intersection. After selecting the crashes, you can review the statistics, create a crash diagram, or download the complete data files to conduct further analyses. There are three different ways to select crashes.
By Drawing
The drawing tool allows you to draw a shape around the crashes that you want to select. Choose either the Point, Multi-Points, Polyline, Rect, Polygon, or Free Hand tool. Click your mouse to draw around the crashes and let go to complete your selection.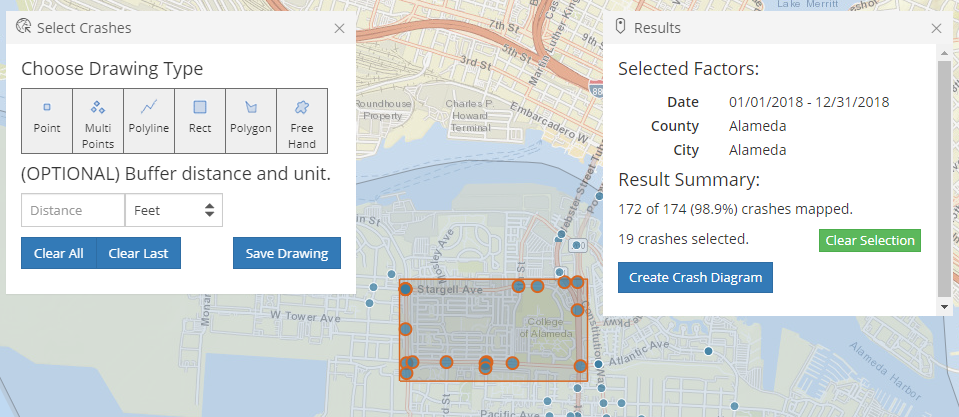
By Buffer
The Select by Buffer tools can give more precise measurements. For example, you may want to select crashes within 25 feet of a corridor (left), or 75 feet of multiple intersections (right).
- Enter a buffer distance.
- Choose a shape. Hovering over a shape button provides a description (e.g., Point, Multiple Points, Line, etc.).
- Follow the on-screen instructions on the map.
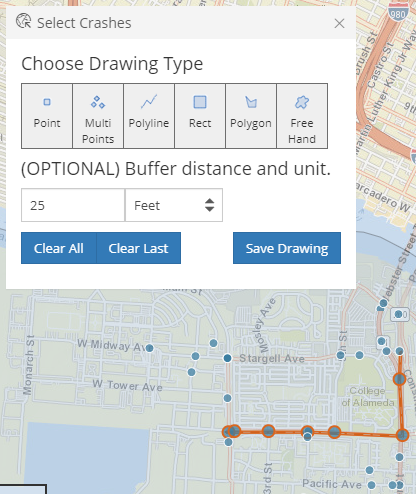
Select by Buffer: Polyline
25 ft
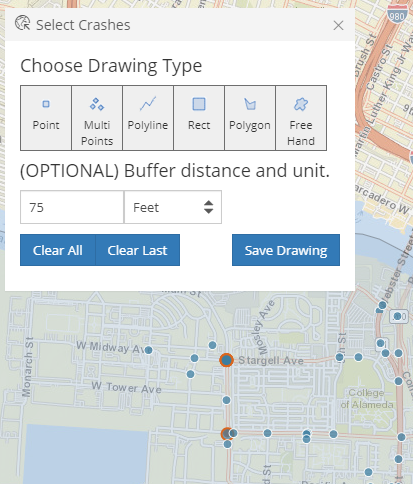
Select by Buffer: Multiple Points
75 ft
Create Crash Diagram
Once you have spatially selected a subset of crashes, the Results box will show the option to Create Crash Diagram. This option will open a new browser window that attempts to show all the crashes with appropriate movement and crash type symbols in an interactive Google maps style. The user can then generate a single page diagram summary for printing. For more information on using the crash diagram tool, please refer to the separate help document Crash Diagram Tool User Guide.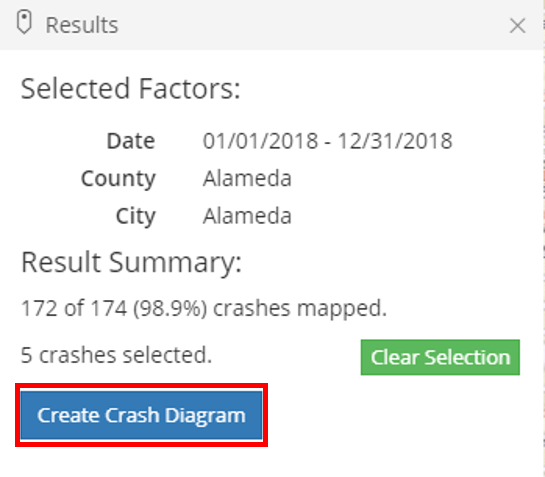
Download Crashes
The Download Crashes tool shows a pop-up window with several options.
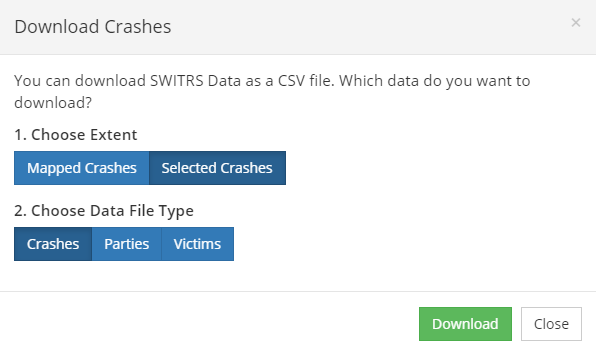
First, users should choose the extent of interest: All Mapped Crashes or Selected Crashes (disabled if no crashes are selected).
Next, the type of data file should be chosen: Crashes, Parties, or Victims. Typically, the crashes file will be of interest but you may also be interested in the Parties and/or Victims file.
Note: Crashes, parties, and victims are related to each other hierarchically, with crashes being the parent or top entity. This means that crashes are first narrowed down by selected crash factors, next by party factors, and then finally by victim factors. For more information, go to the SWITRS Help page> Working with the relational database structure.
Rank by Intersection
![]() Use the Rank by Intersection tool to rank major intersections by total crash count.
Use the Rank by Intersection tool to rank major intersections by total crash count.
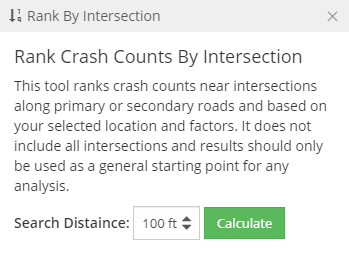 After selecting Rank by Intersection from the Tools menu, select the distance that you want crashes to be included in an intersection's crash count. For each intersection, the higher its rank, the more crashes occurred within it.
Once you have selected a distance and pressed calculate, the top 10 intersections will be displayed. Click on a result to zoom in to the selected intersection on the map.
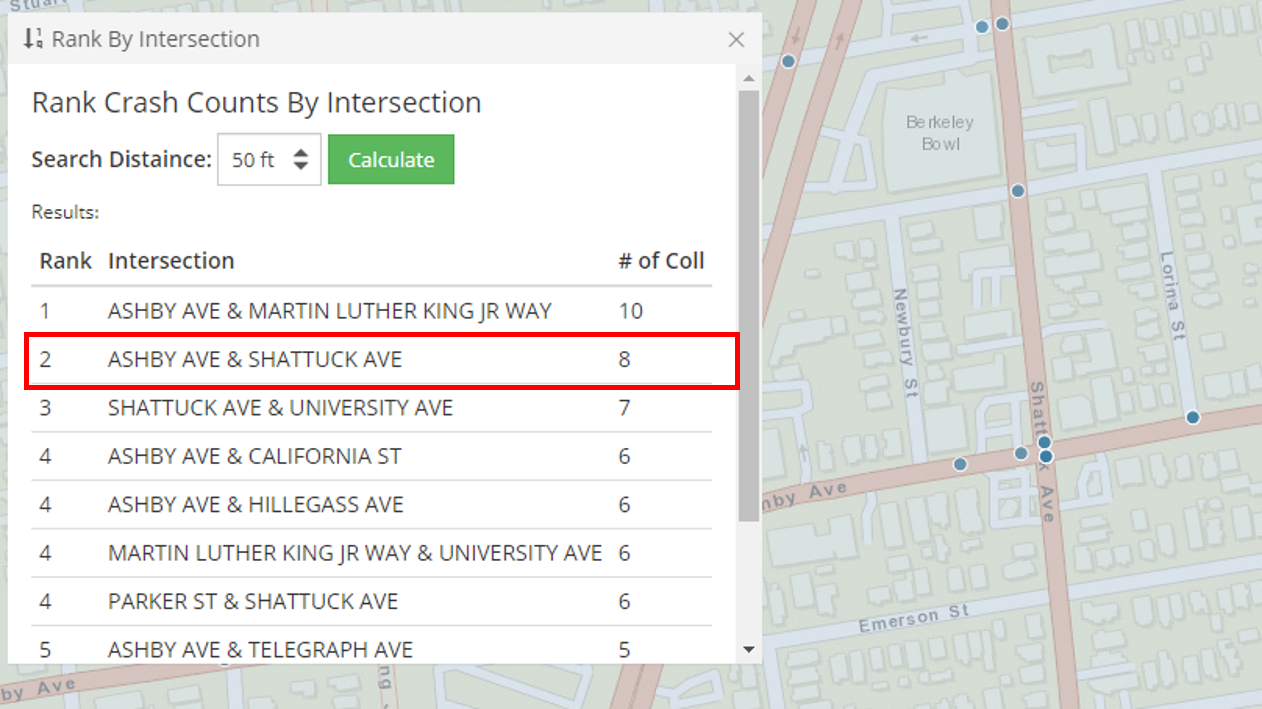
Note: Only crashes that match your selected date, location, and other factors are used. Additionally, this tool only ranks crash counts for intersections in which one of the intersection's roads is a primary road or secondary road. Primary and secondary roads are any of the 10 types of roads listed in the A2 and A3 series. For more info, see this list of Census Feature Class Codes.
Crash Summary
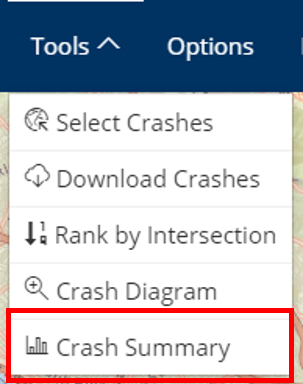 Select the Crash Summary tool from the tools dropdown to view an in-depth summary of the mapped crashes. Users can choose to see summary results from all crashes or only selected crashes.
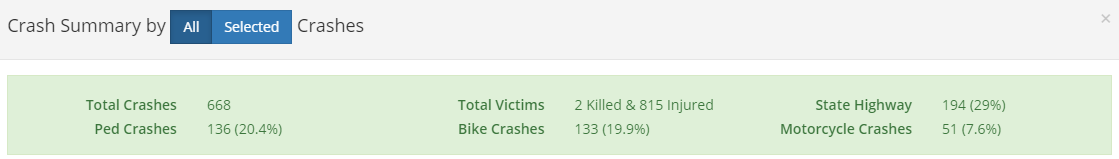
The top section of the summary window displays the total number of crashes that match your query, as well as the number and percentage of crashes by five commonly viewed crashes filters.
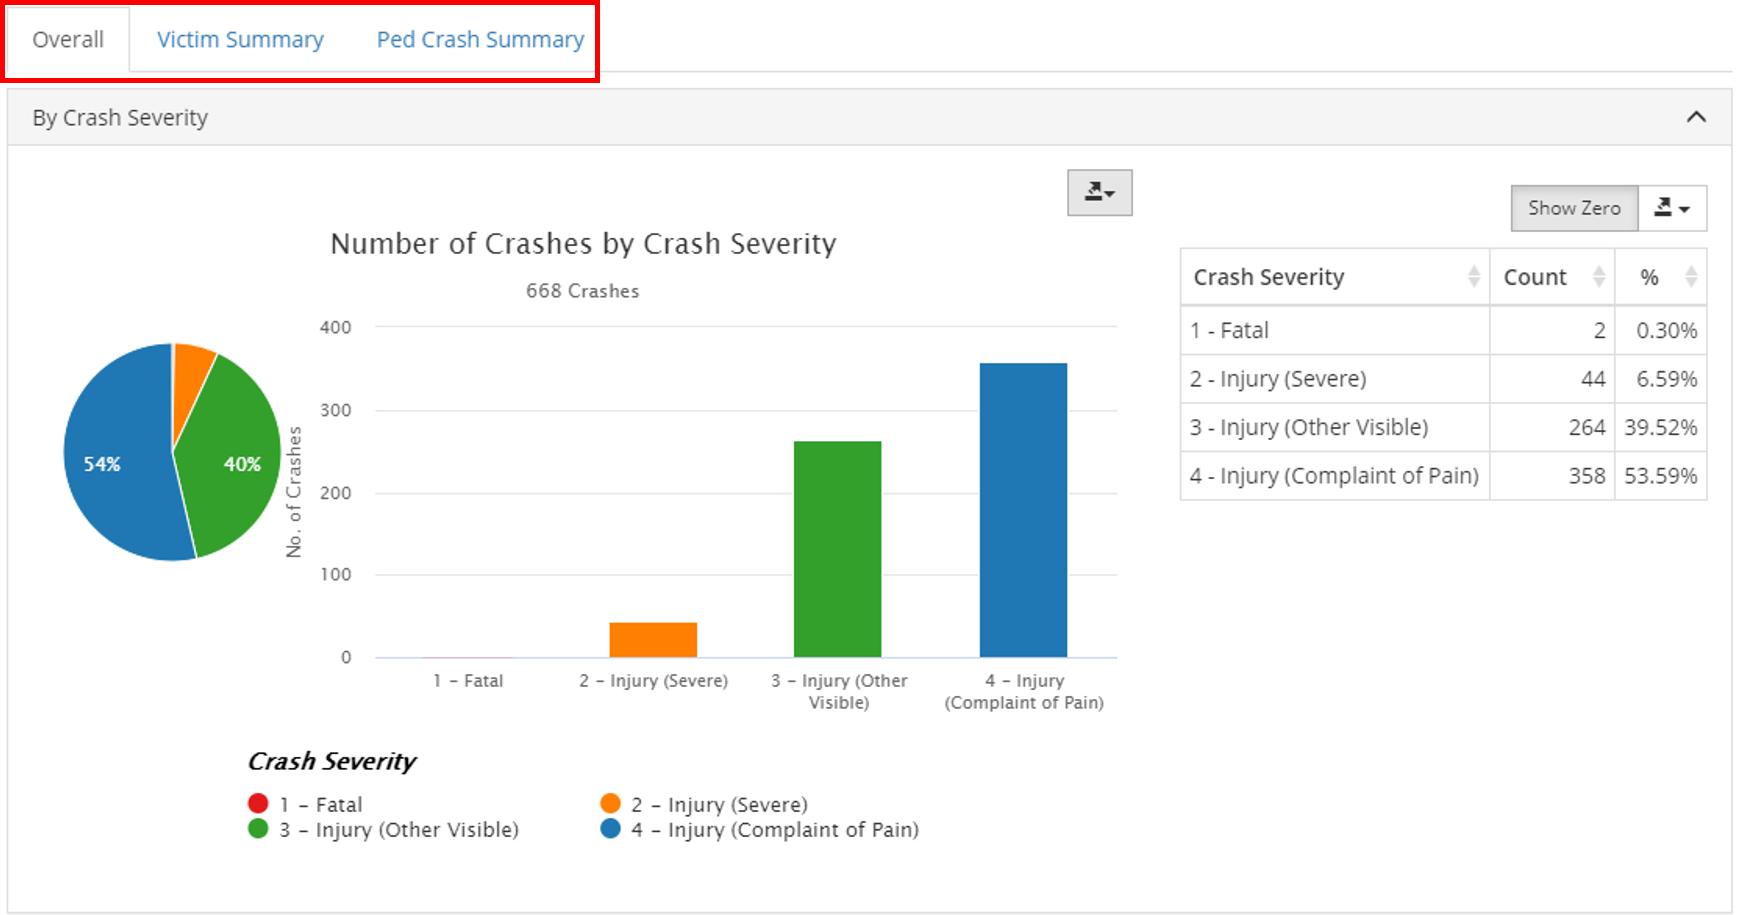
Additionally, below the Results Summary, you will find graphs and charts depicting the most frequently viewed filters for three categories: Overall, Victim Summary, and Ped Crash Summary. You can select which category to view from the bar highlighted in red. For example, below is a pie graph that depicts the number of crashes by crash severity.
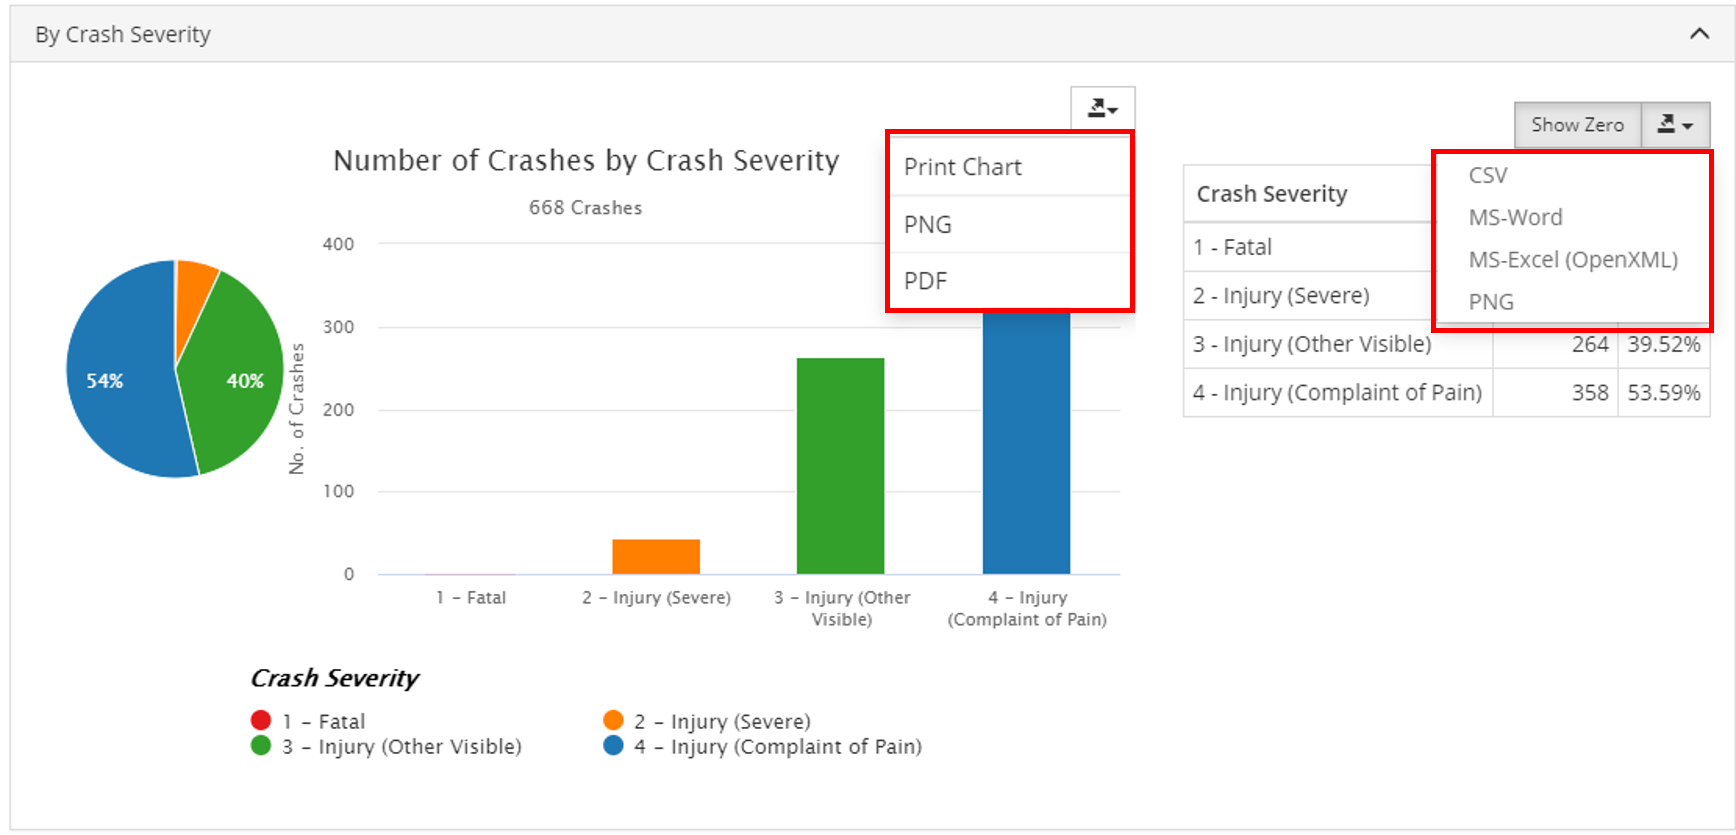
You can also print and export the graphs and tables in various formats by clicking on the export icons.
Display Options
There are several different ways to symbolize crashes. Display options can be changed by clicking Options in the toolbar. A pop-up will then appear on the left side of the screen.
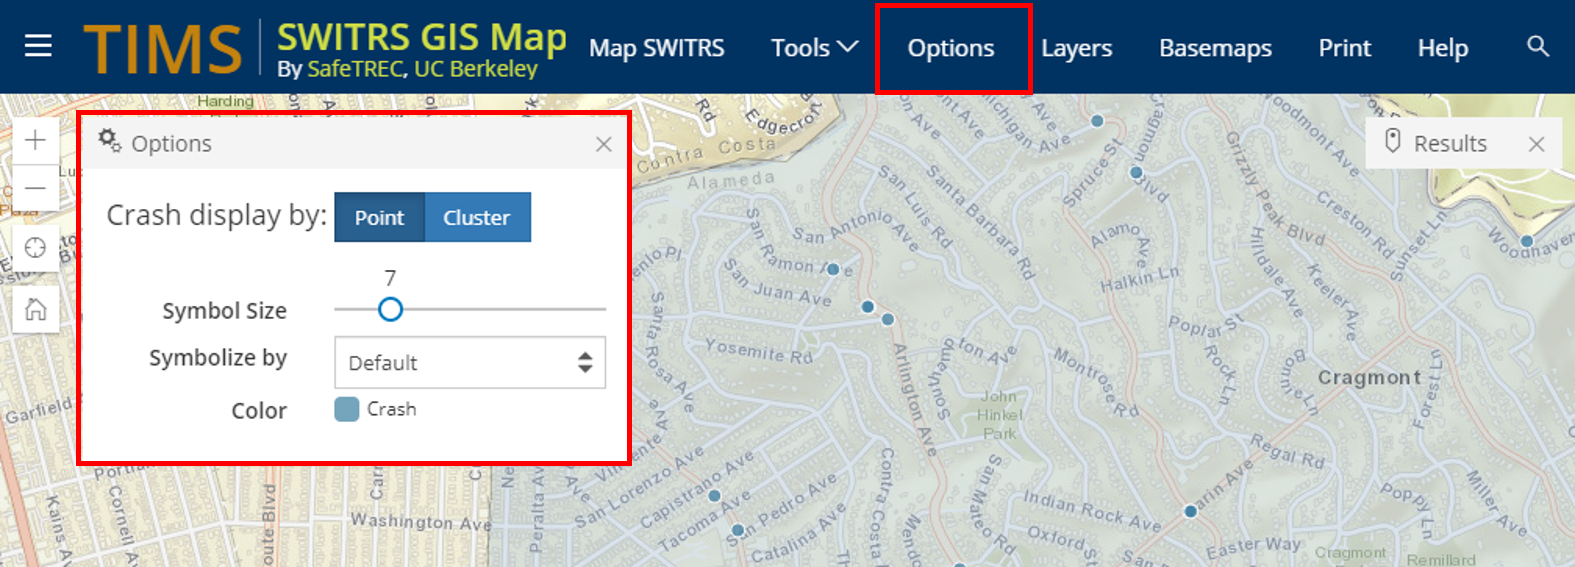
Display
Crashes can be symbolized by either points or clusters
Points
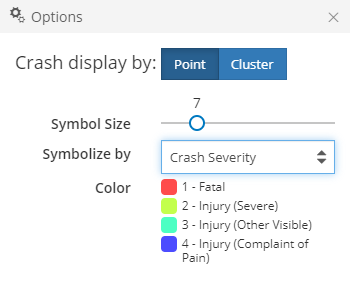 You can change the size of the points and choose to display the crashes as symbols stratified by Crash Severity, Type of Crash, or Motor Vehicle Involved With. After selecting a type of stratification, you can then choose to turn on/off colors for each value.
Clusters
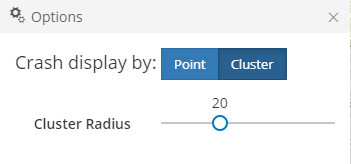 Large number of crashes are better symbolized by clusters. Users can choose different cluster radius. Larger radius will result in fewer number of clusters.
Layers
Layers refer to the different layers that can be displayed on the map and is accessible from the main toolbar. Users can select from several standard layers or import one of their own point layers.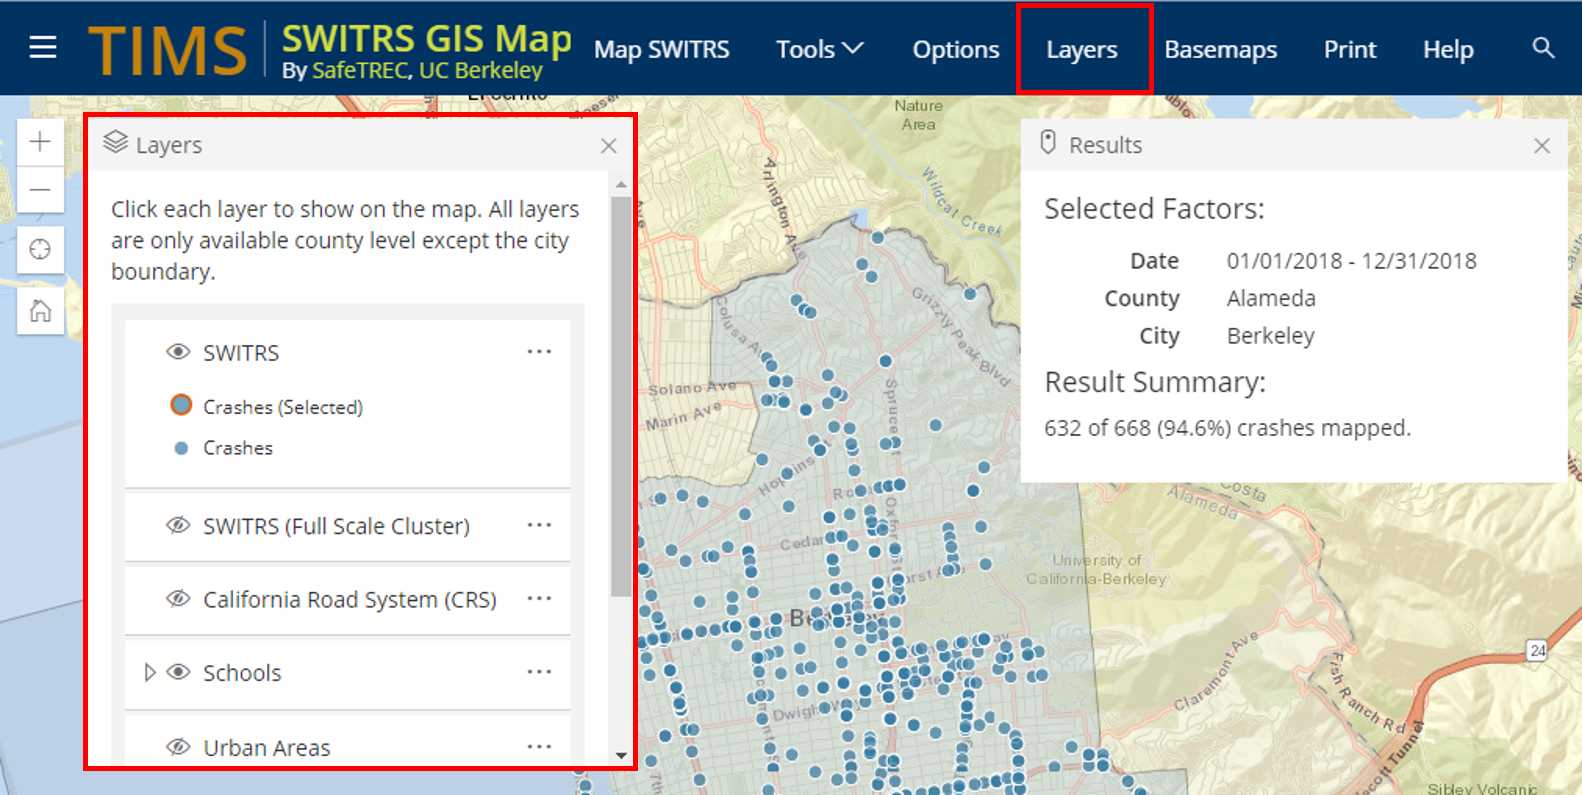
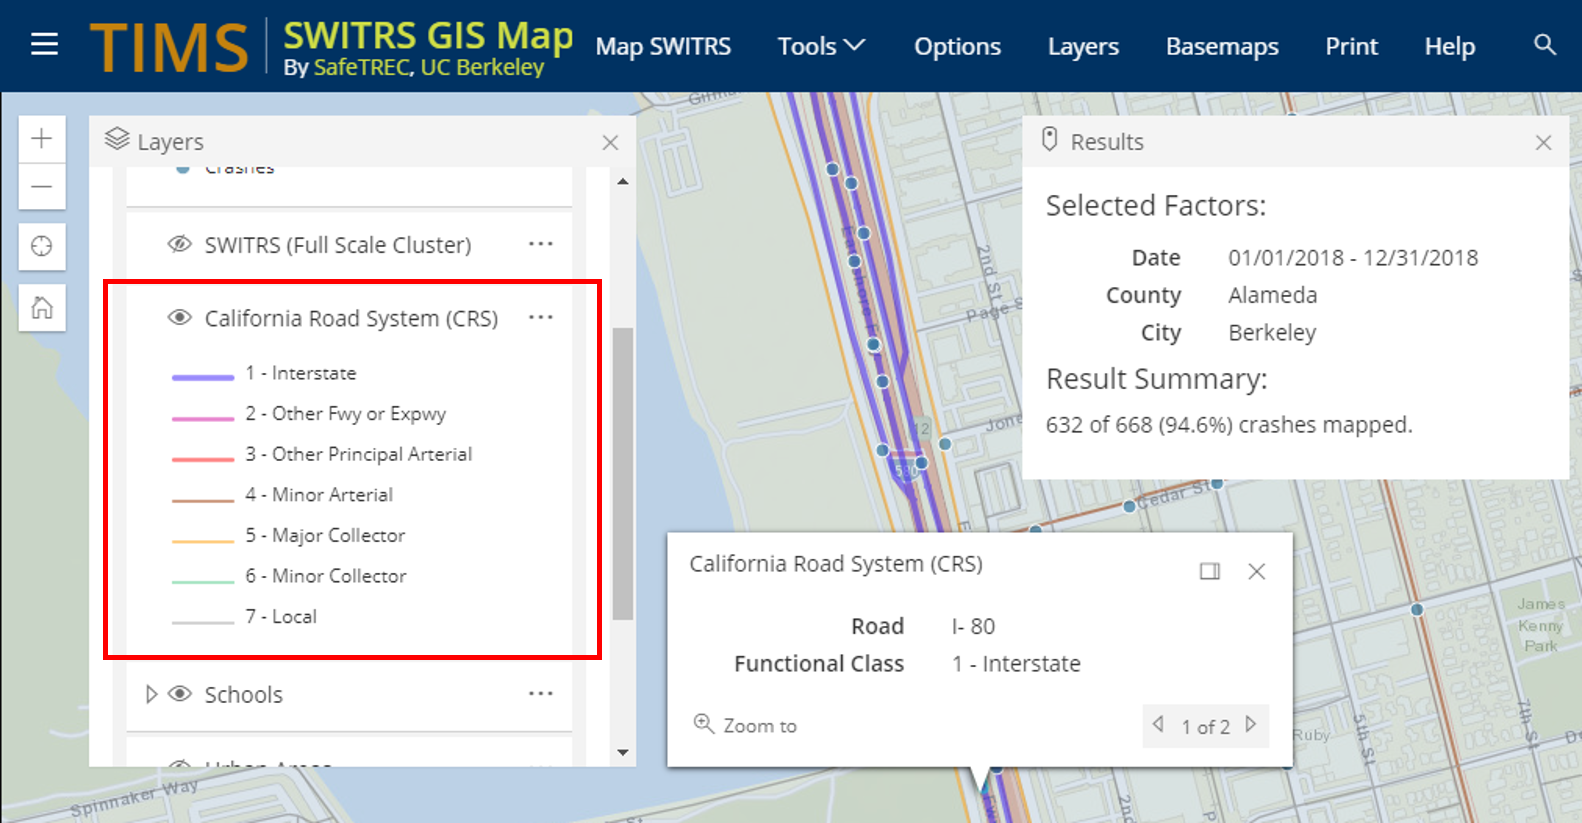
California Road System (CRS)
California Road System layer is available to display functional classification of public roads at city/county level. This layer is unofficial data and may not have the most current functional classifications. For official data and more information, please visit California Department of Transportation website:
http://www.dot.ca.gov/hq/tsip/hseb/func_clas.html
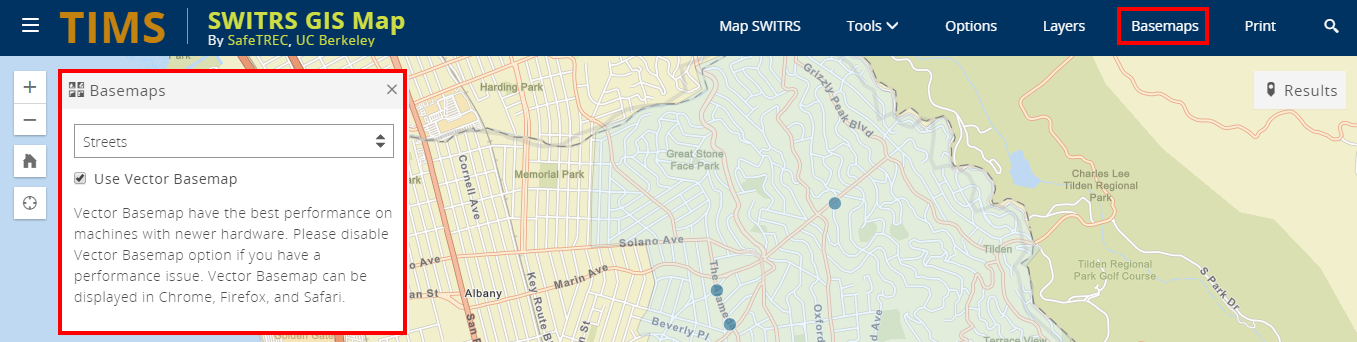
Basemaps
Switch to a basemap by clicking it from the Basemap dropdown menu. A basemap presents background referential information such as roads, landmarks, political boundaries, and landforms. The default basemap in the SWITRS GIS Map is Streets. Vector Basemaps have the best performance on machines with newer hardware. Please disable the Use Vector Basemap option if your computer has performance issues. Vector Basemaps can be displayed in Chrome, Firefox, and Safari.
List of Basemaps
| Basemap | Description | Vector Basemap Available | |
 |
Streets (Default) | Comprehensive map with street-level data. Depending on how zoomed in or out you are on the map, the basemap can include street names, water features, and other physical/political/economic points of interest such as parks, schools, and hospitals. | Yes |
 |
Satellite | High-resolution aerial imagery; no labels. | No |
 |
Hybrid | Same as Imagery, but includes labels of major streets, institutions, cities, and other points. Depending on how zoomed in or out you are on the map, the number and placement of labels that is displayed will vary. | No |
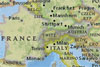 |
National Geographic | Shaded relief map that uses National Geographic's cartographic and typographic design. This basemap shows administrative boundaries, protected areas, streets, railways, highways, water features, buildings, and landmarks. | No |
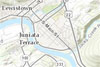 |
Topographic | Detailed topographic map that shows and labels political boundaries, water features, parks, landmarks, buildings, transportation, and other features. | Yes |
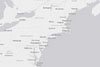 |
Light Gray | Minimalist map with light neutral colors and minimal labels for major streets and points of interest. This basemap is useful when you do not want detailed street information (as with Streets and OpenStreetMap) to be distracting. | Yes |
 |
Dark Gray | Minimalist map with dark neutral colors and minimal labels for major streets and points of interest. This basemap is useful when you do not want detailed street information (as with Streets and OpenStreetMap) to be distracting. | Yes |
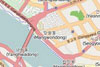 |
OpenStreetMap | Collaborative map that displays data collected via the OpenStreetsMap project. For some locations, this layer may be more updated than other street basemaps. | No |
 |
Streets Night | Detailed vector basemap that displays a custom "night time" street map style. When the Use Vector Basemap option is deselected, it becomes the dark gray basemap. | Yes |
 |
Streets Relief | Shaded relief map that shows highways, major roads, minor roads, railways, water features, cities, parks, landmarks, building footprints, and administrative boundaries. When the Use Vector Basemap option is deselected, it becomes the streets basemap. | Yes |
 |
Streets Navigation | Comprehensive map with a custom navigation map style that is designed for use during the day in mobile devices. When the Use Vector Basemap option is deselected, it becomes the streets basemap. | Yes |
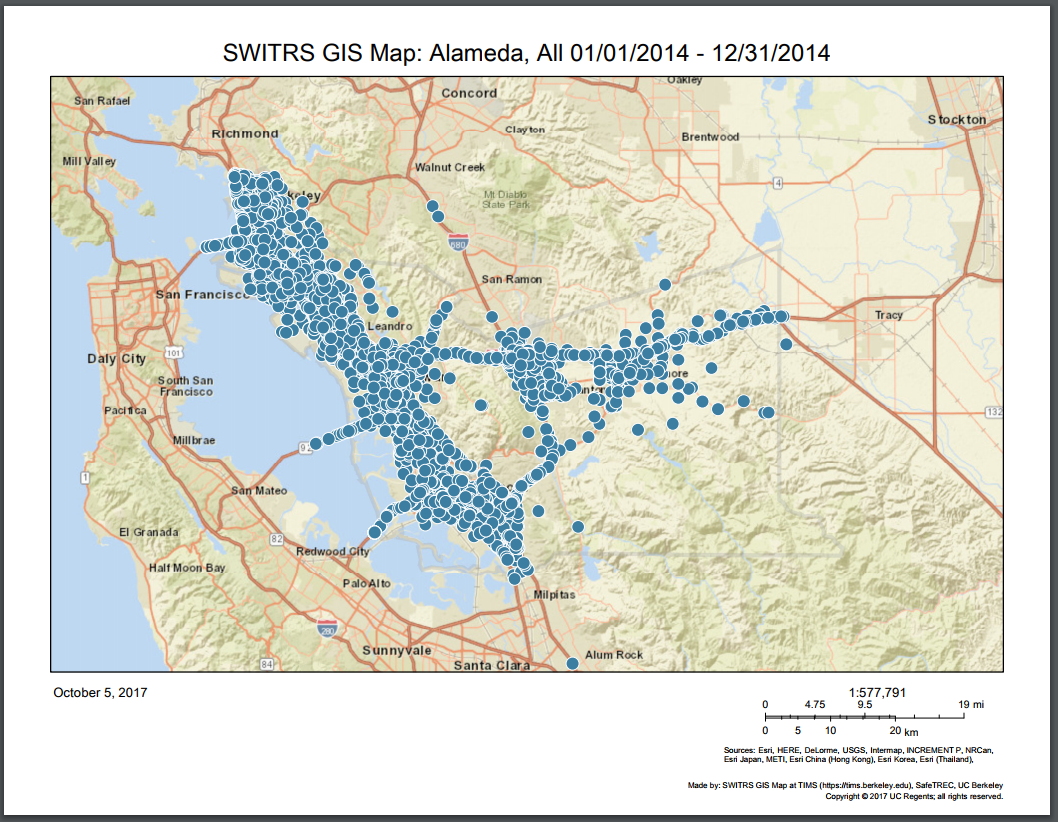
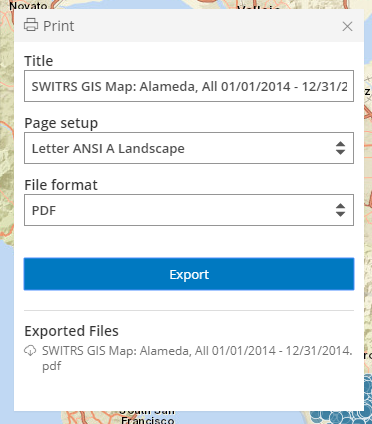 Print out the current query and mapping. The toolbar to the left will populate with your current map selection, and upon clicking "export," the following PDF is generated.
Location Search Bar
 To find a location on the map, enter an intersection or address, including the city and state into the Location Search Bar in right of the main toolbar; next, click the Search icon or hit enter on the keyboard, and the map will zoom to that location. If an exact location cannot be found, it will zoom to the nearest identifiable location such as the street or city.
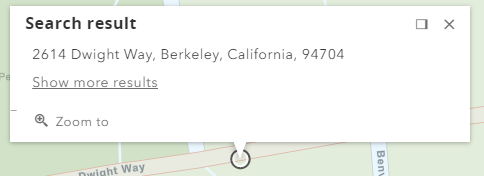
A white triangle will point to the address or intersection, and a pop-up window will also display the address or location.
Side Menu
Pressing the icon towards the left of the toolbar will display a side menu that contains the same options.