Introduction
The SWITRS Query & Map application is a tool for accessing and mapping crash data from the California Statewide Integrated Traffic Records System (SWITRS). To use this tool, click on SWITRS Query & Map from the Tools dropdown menu. This user guide explains how the three steps in the tool work, as well as additional tips.
1. Select Date and Location
The first step allows you to select the year(s) and location(s) that you are interested in for crash data.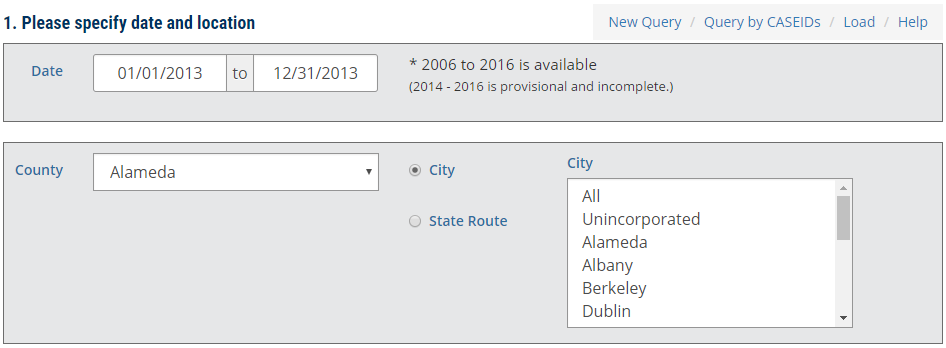
Select Date
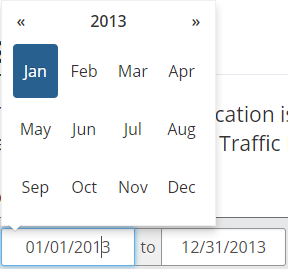 Choose your timeframe. You can either type the start and end dates directly into the fields, or select them from the calendar pop-up menu.
Note: The default timeframe on the tool is for the most recent complete year of SWITRS data available. There may be provisional data for the next year also available.
Select Location
After selecting your timeframe, you can next select the county of interest. You will then have the option to select either the Cit(ies) or State Highway(s) that are of interest within that county.
City
If you choose City, the city box will populate with all the cities in that county, as well as an option to choose the unincorporated areas.
State Highway
If you are interested in a particular state route, select State Highway, and the highways in your county will populate. From here, you can also choose the direction of the highway.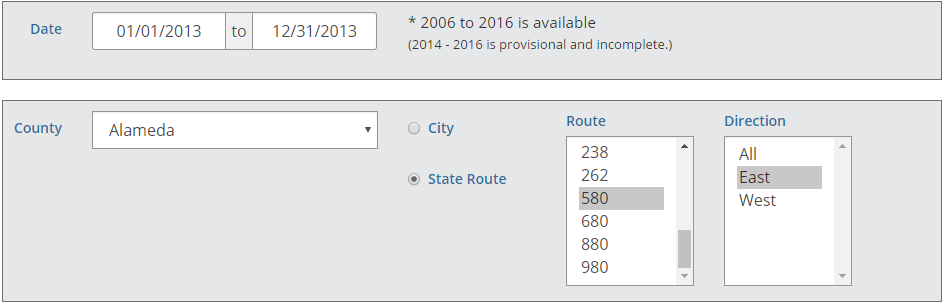
After you have selected the county, city, or highway of interest, click on Select Filters to continue.
- Windows: Ctrl + Click
- Mac OS: ⌘ + Click
2. Select Filters
In Step 2, you can choose among three different types of filters to help narrow down the crashes: crash filters, party filters, or victim filters.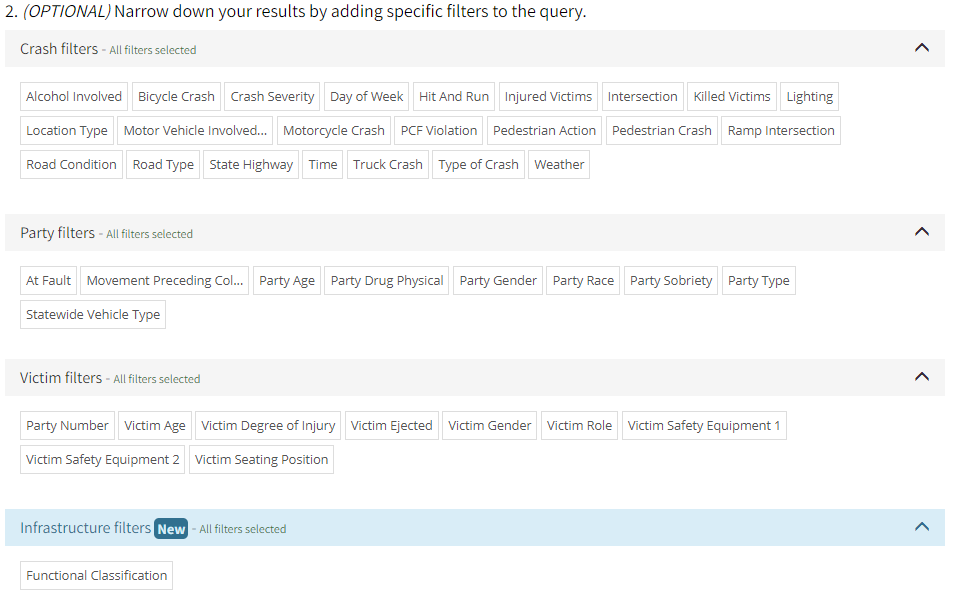
Note: Crashes, parties, and victims are related to each other hierarchically, with crashes being the parent or top entity. This means that crashes are first narrowed down by selected crash filters, next by party filters, and then finally by victim filters. For more information, go to the SWITRS Help page> Working with the relational database structure.
Crash Filters
Crash filters are the SWITRS variables that directly relate to crashes. (Note: you do not have to select a crash, party, or victim filter to continue on to the Summary page.) When you select or check a filter that you are interested in, that filter's values will populate at the top of the filter options. You can then select the values that pertain to your project.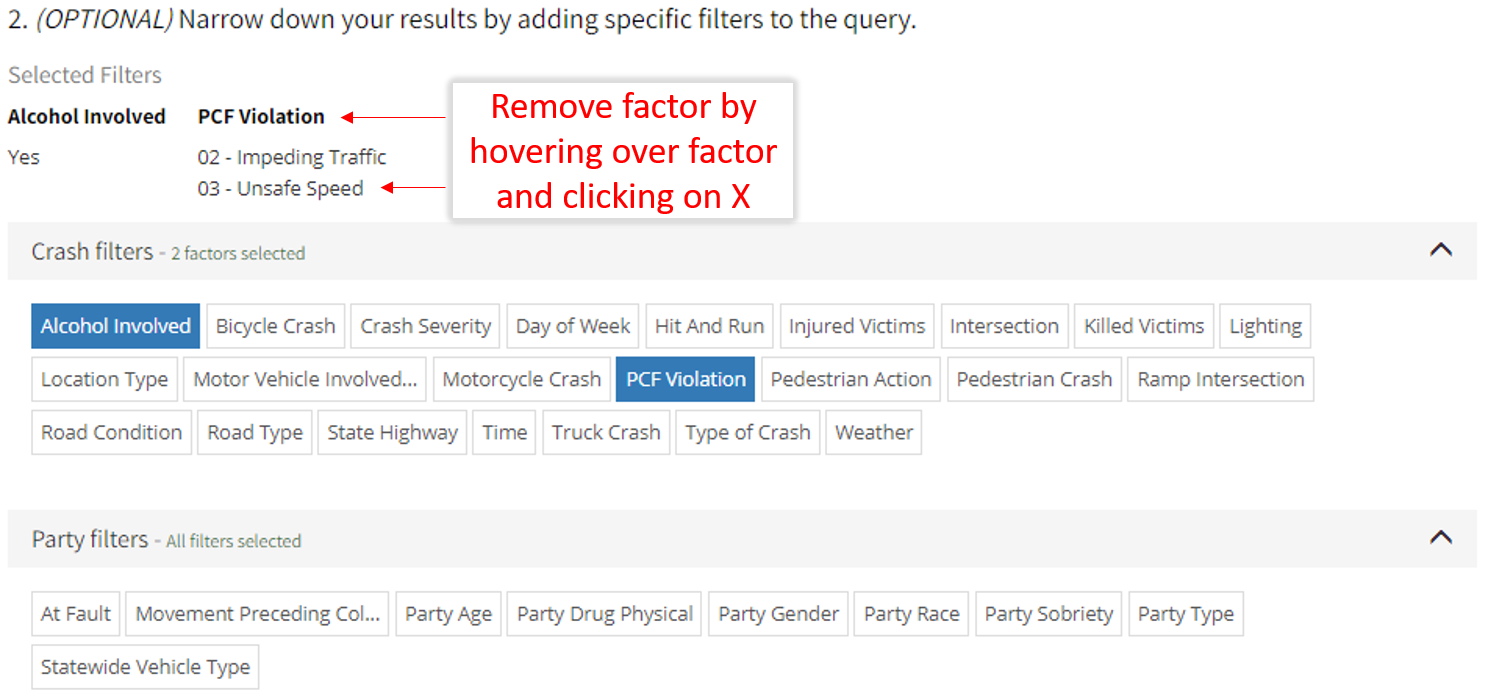
Tip: At the top right of each filter tab, there are buttons to Check All Filters, Uncheck All filters, or Remove the Selected filter. You can also remove a previously selected filter through the Current Selection blue box on the right of the screen. Simply hover over the filter, and click on the X to the left of each filter.
Party Filters
Every crash has one or more parties involved. If you had previously selected a crash filter, these crashes will then be further refined by party filter.
Victim Filters
A victim is any person who was involved in the crash; he/she is included in one of the involved parties. There can be more than one victim in each party. Select the victim filters and the associated values that you are interested in for your project.
Infrastructure Filters
Infrastructure filters relate to the built environment where the crash happened. At this time only Functional Classification filter is available. To learn more about functional classification, please visit our SWITRS help page.
When you have finished selecting filters, click Continue.
3. Results
The Results page is the final screen. Remember that you can go back and change/remove any of the selected filters by clicking Change Filters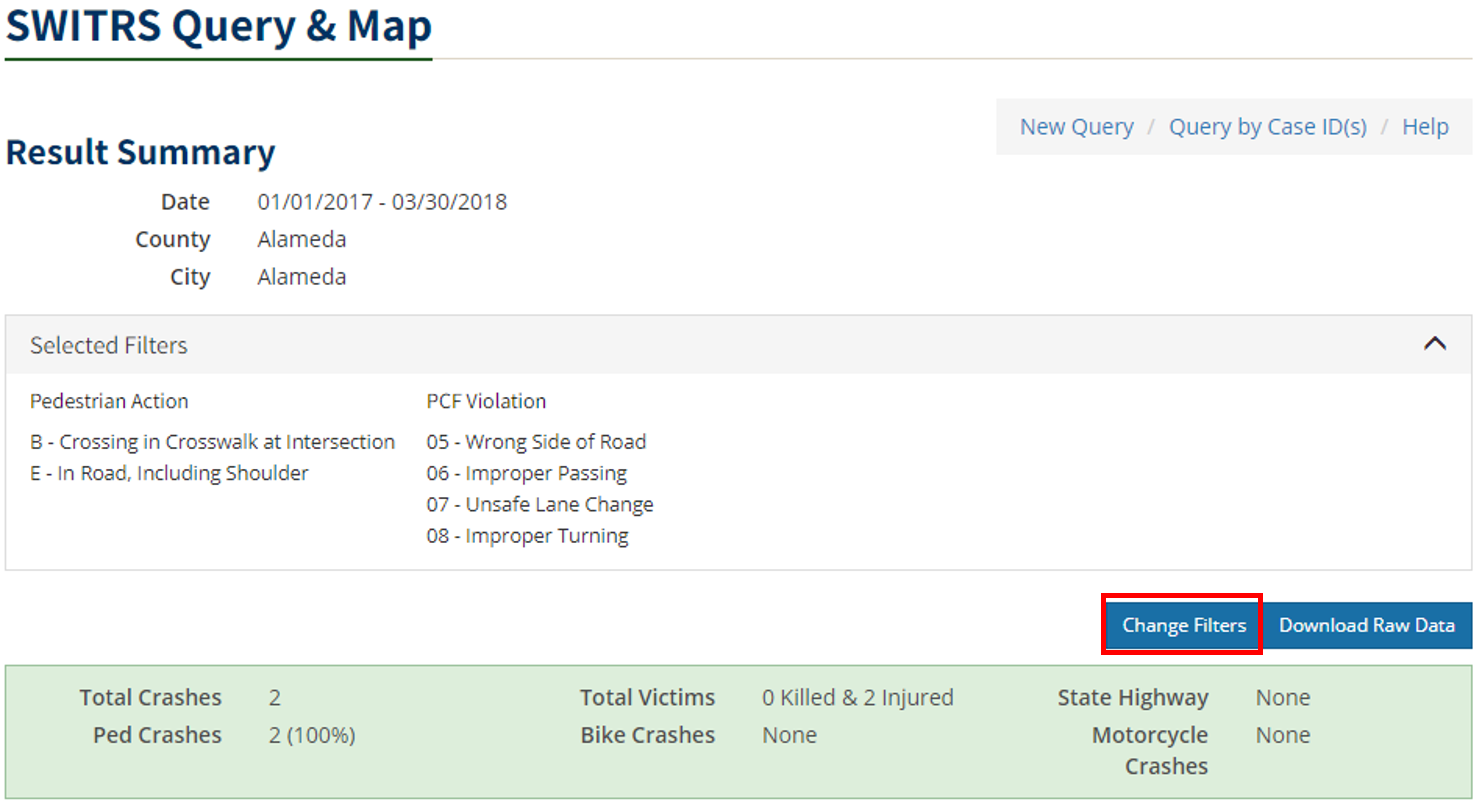
Results Summary
In the top half of the page, you will see Results Summary for the crashes that you have queried. The Selected Filters are shown in a collapsible window. This section also displays the total number of crashes that match your query, as well as the number and percentage of crashes by five commonly looked at crash filters. Note that these summary results are showing you only crash data. You can quickly copy and paste the information from these tables into another document.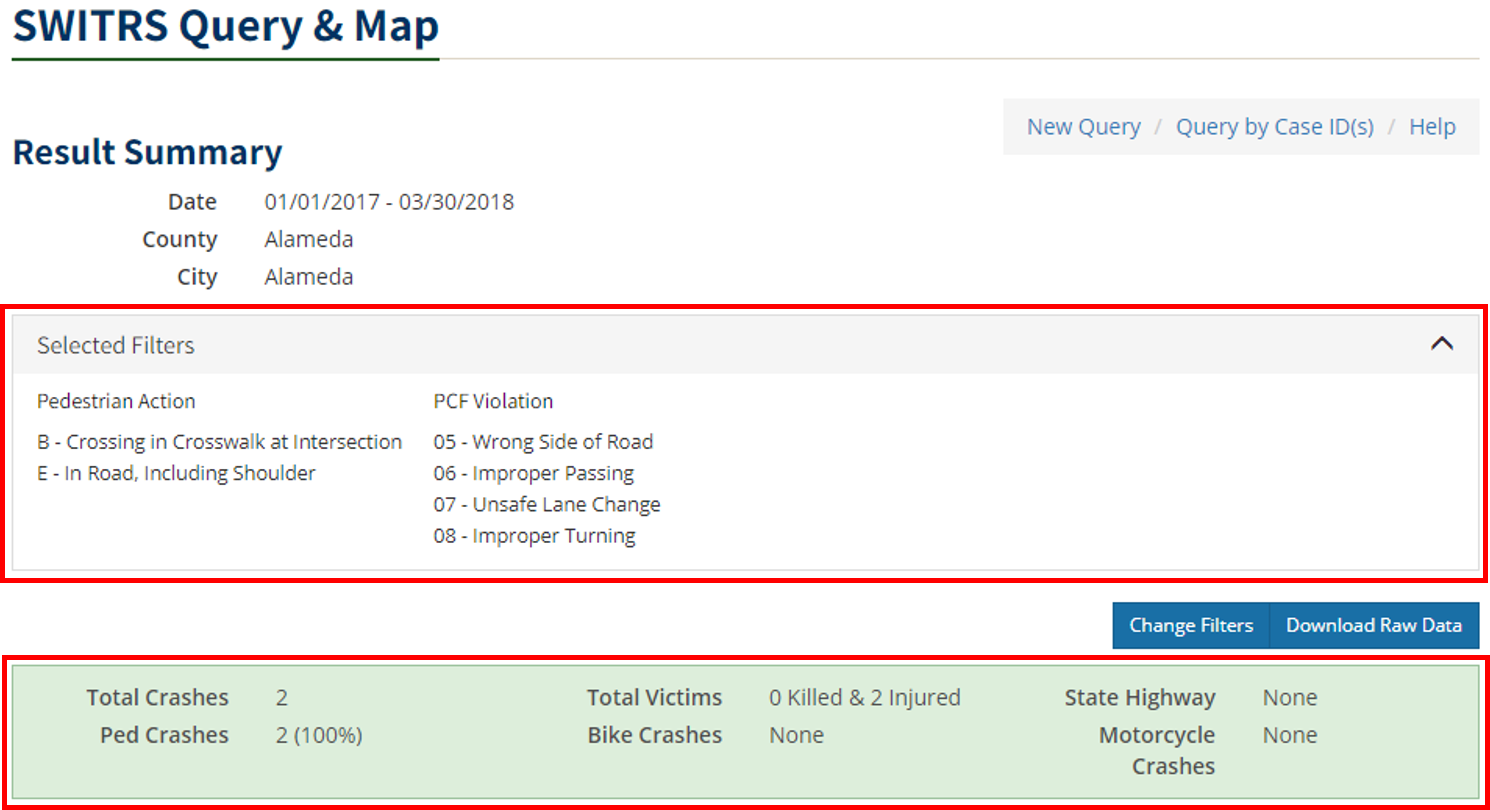
In addition, below the Results Summary are graphs and charts that illustrate the five most commonly looked at filters for each category (crash, party, and victim). You can select which category to look at from the bar highlighted in red. For example, below is a pie graph that depicts the number of crashes by crash severity. 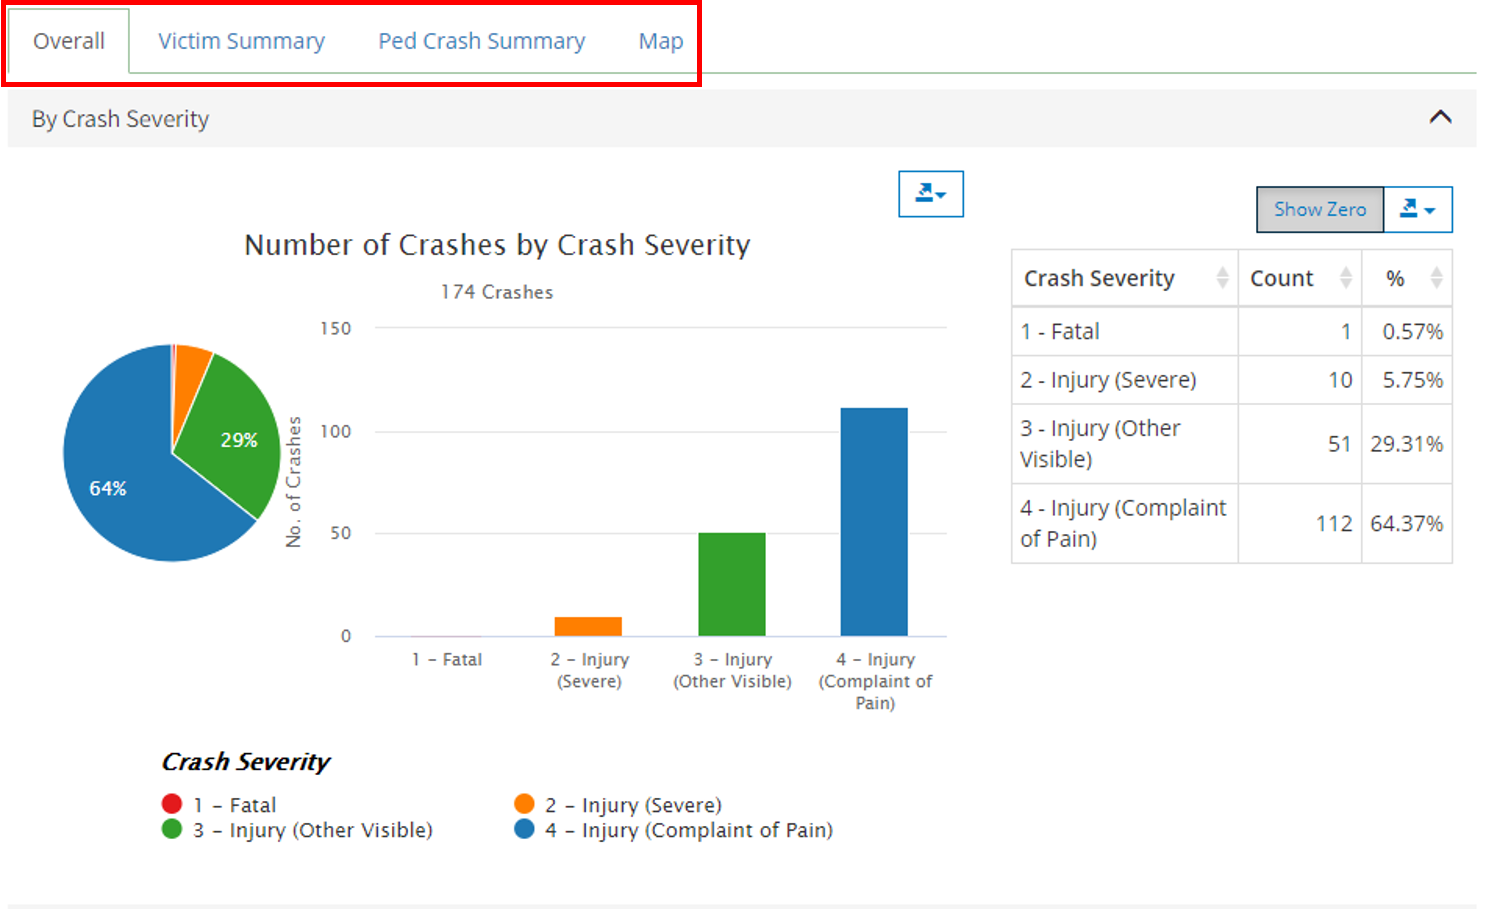
Export Data
You can also print and export the graphs and tables in various formats by clicking on the export icons.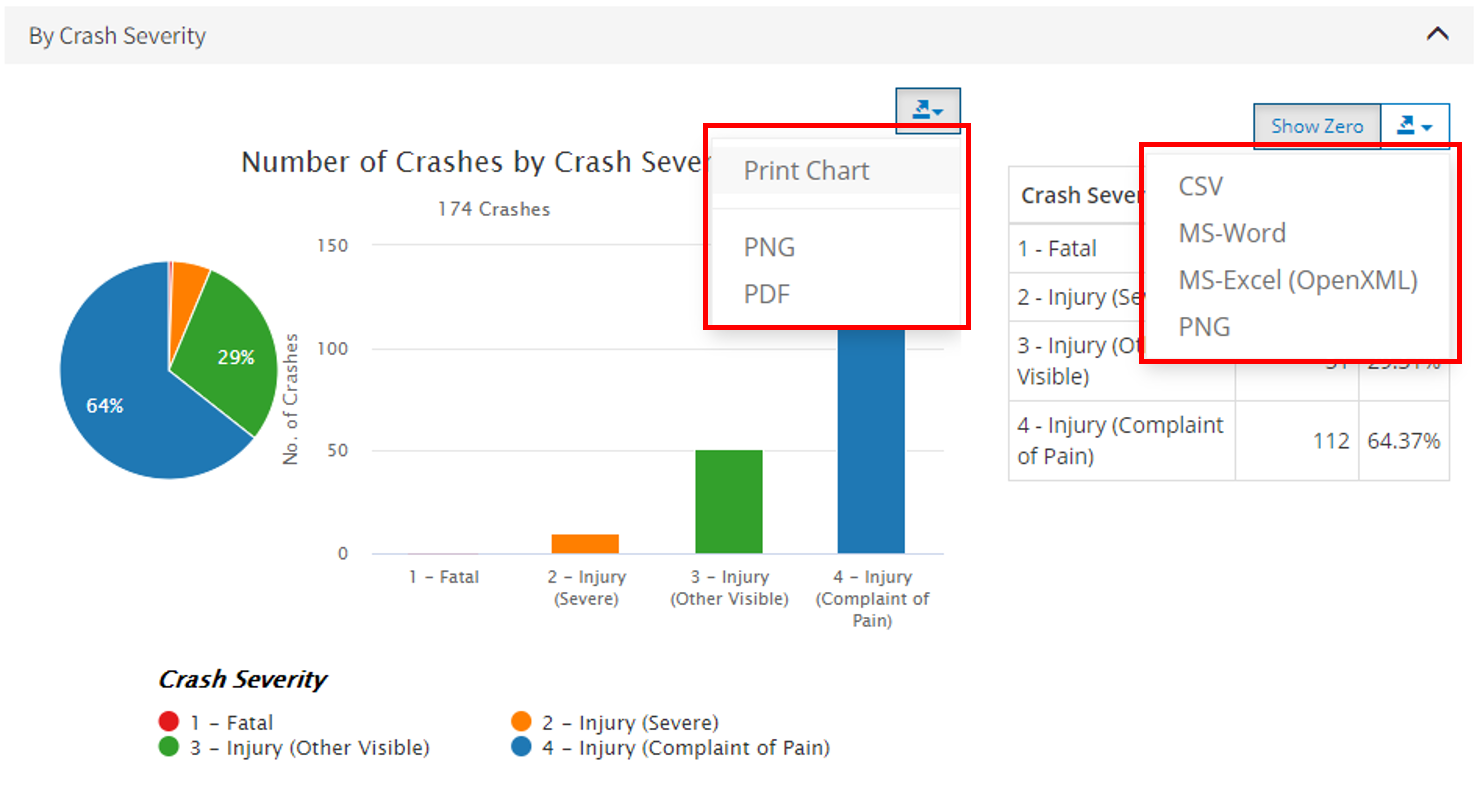
Download Data
There are three types of data that you can download from this page: Crashes, Parties, or Victims data. Click on Download in the results summary. 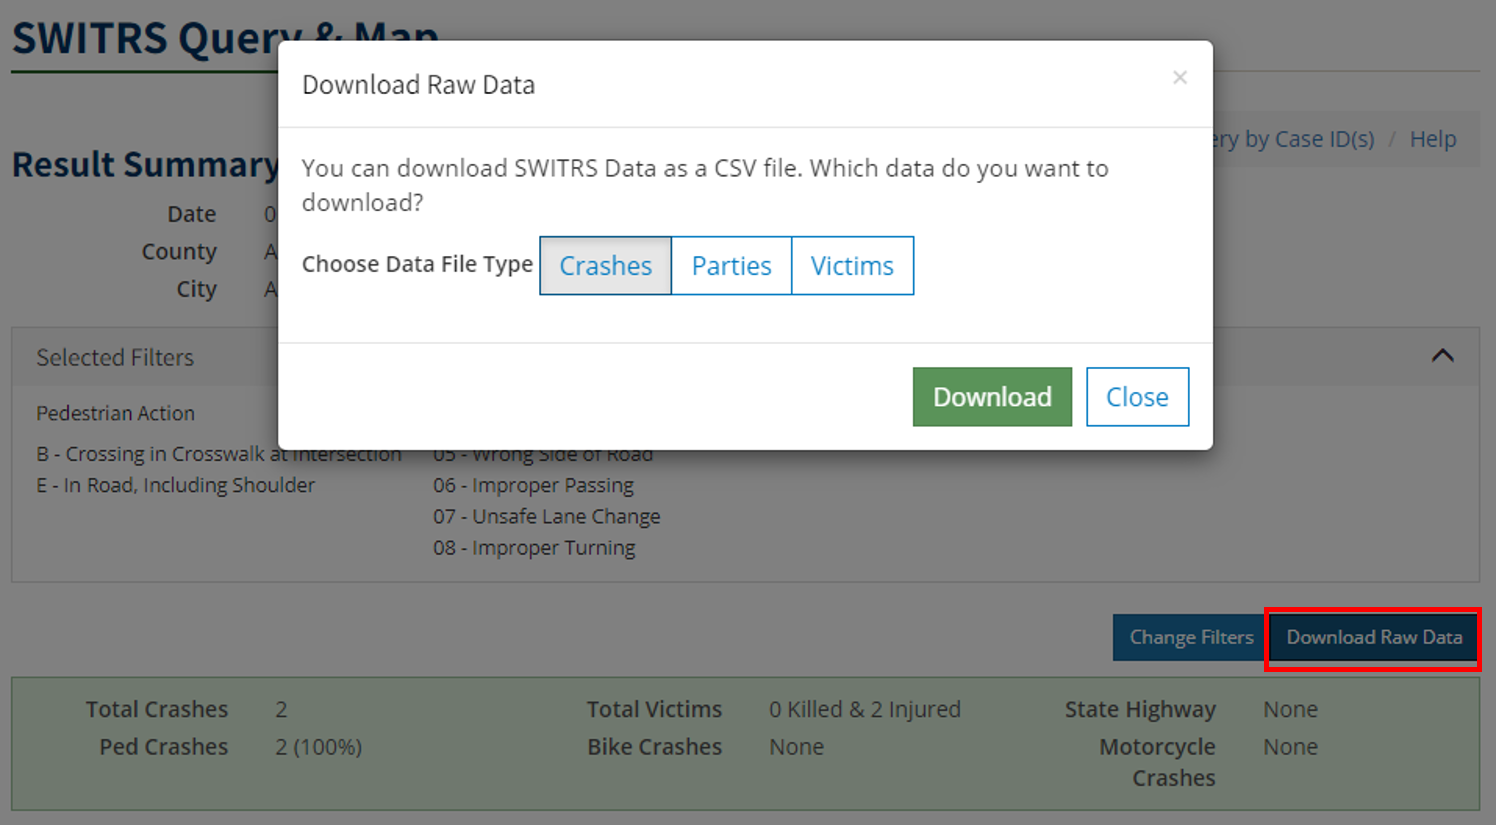
Crash Data
Download the crash data if you are interested in the data at the top crashes level. Once it's downloaded, open the spreadsheet. Notice that there are additional fields in the spreadsheet that weren't shown on the SWITRS Query & Map tool; all of these fields are from the original SWITRS database. Use the SWITRS Help page to learn about the fields, their descriptions, and possible values.
Each crash has a geocoded latitude and longitude coordinate in the POINT_X and POINT_Y fields. These fields are used to map the crashes. Some crashes have a 0 in these two fields, indicating that these crashes could not be mapped. For more information on why a crash could not be mapped, see SWITRS Geocoding. The data you now have in this spreadsheet can next be used in the Benefit-Cost Calculator tool, or any analysis of your choice.
Query Options
The query options listed in the top-right section of the header allow you to perform different tasks associated with queries.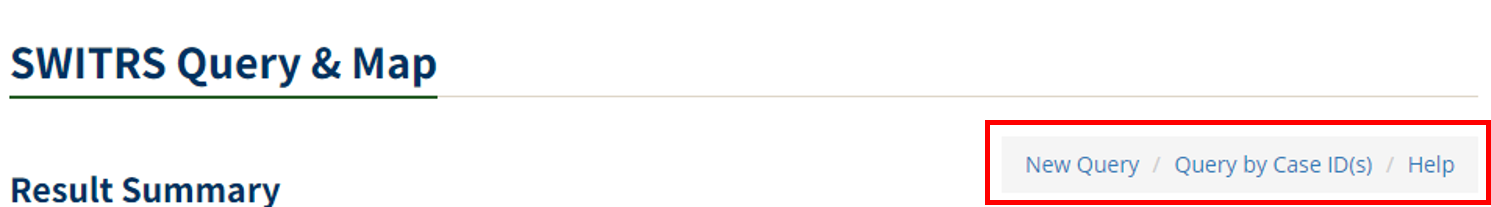
New Query
Click on New Query to start over from the beginning of the tool.
Load CASE IDs
You can also Query by CASEIDS by inputting the ID of each crash in SWITRS. Option 1 allows you to type in the CaseIDs. Make sure to separate them by commas or a space. In Option 2, you can reference a CSV file that contains a list of CaseIDs; this can be a Crash file that you have previously downloaded.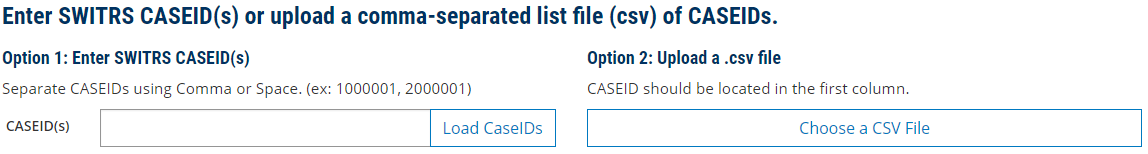
Results Map
Clicking on Map will display all the crashes that could be geocoded and mapped. The number and percentage of the crashes that are mapped are stated at the top of this section; 4 of 4, 100% of crashes are mapped.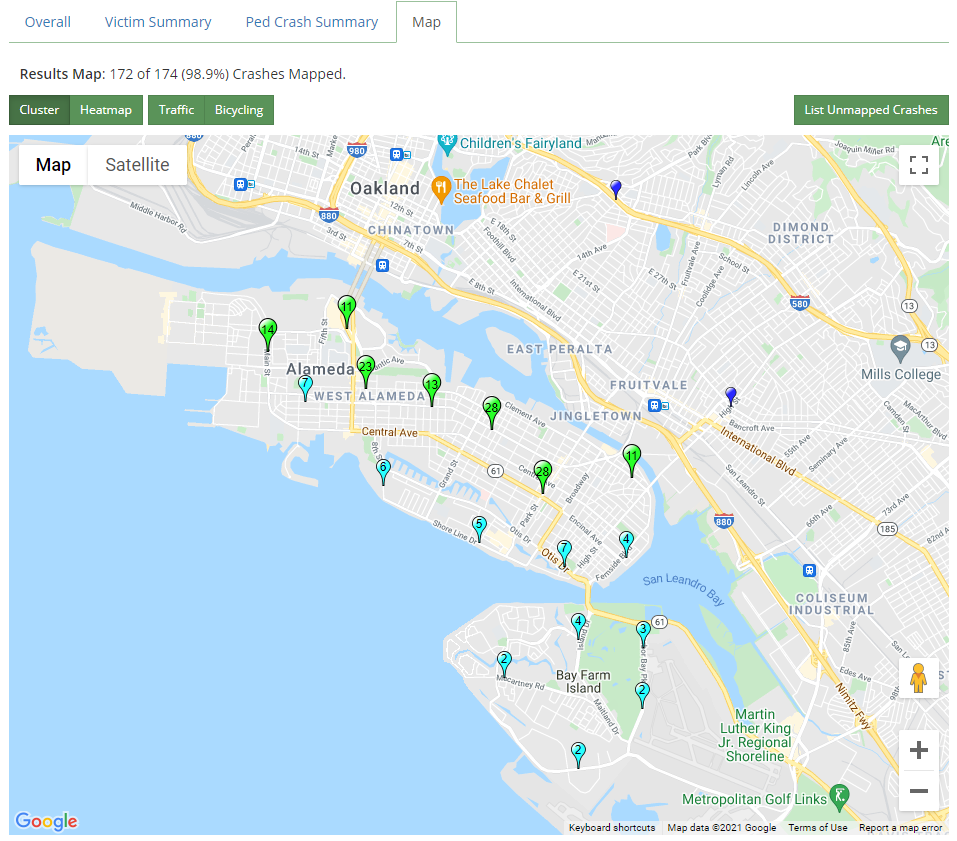
If you are interested in the crashes that were not mapped, click on List Unmapped Crashes, and a page will pop up to show some basic information on these crashes.
Note: For more information on why a crash could not be mapped, see FAQ > Data.
Map Features
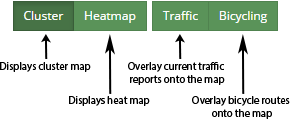
Cluster vs. Heatmap
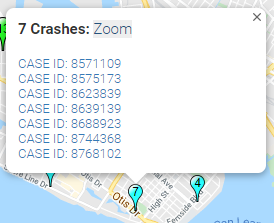 By default, the crashes should be displayed as clusters. You can see that markers' colors and sizes are dependent on the number of crashes. If you click on a marker for a cluster, it will list the crashes at that cluster by intersection. Click Zoom to zoom into the area where that cluster of crashes occurred.
Basic Crash Information
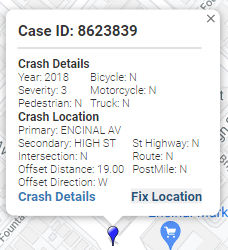 Click on a marker for a crash to bring up more information about that specific crash.
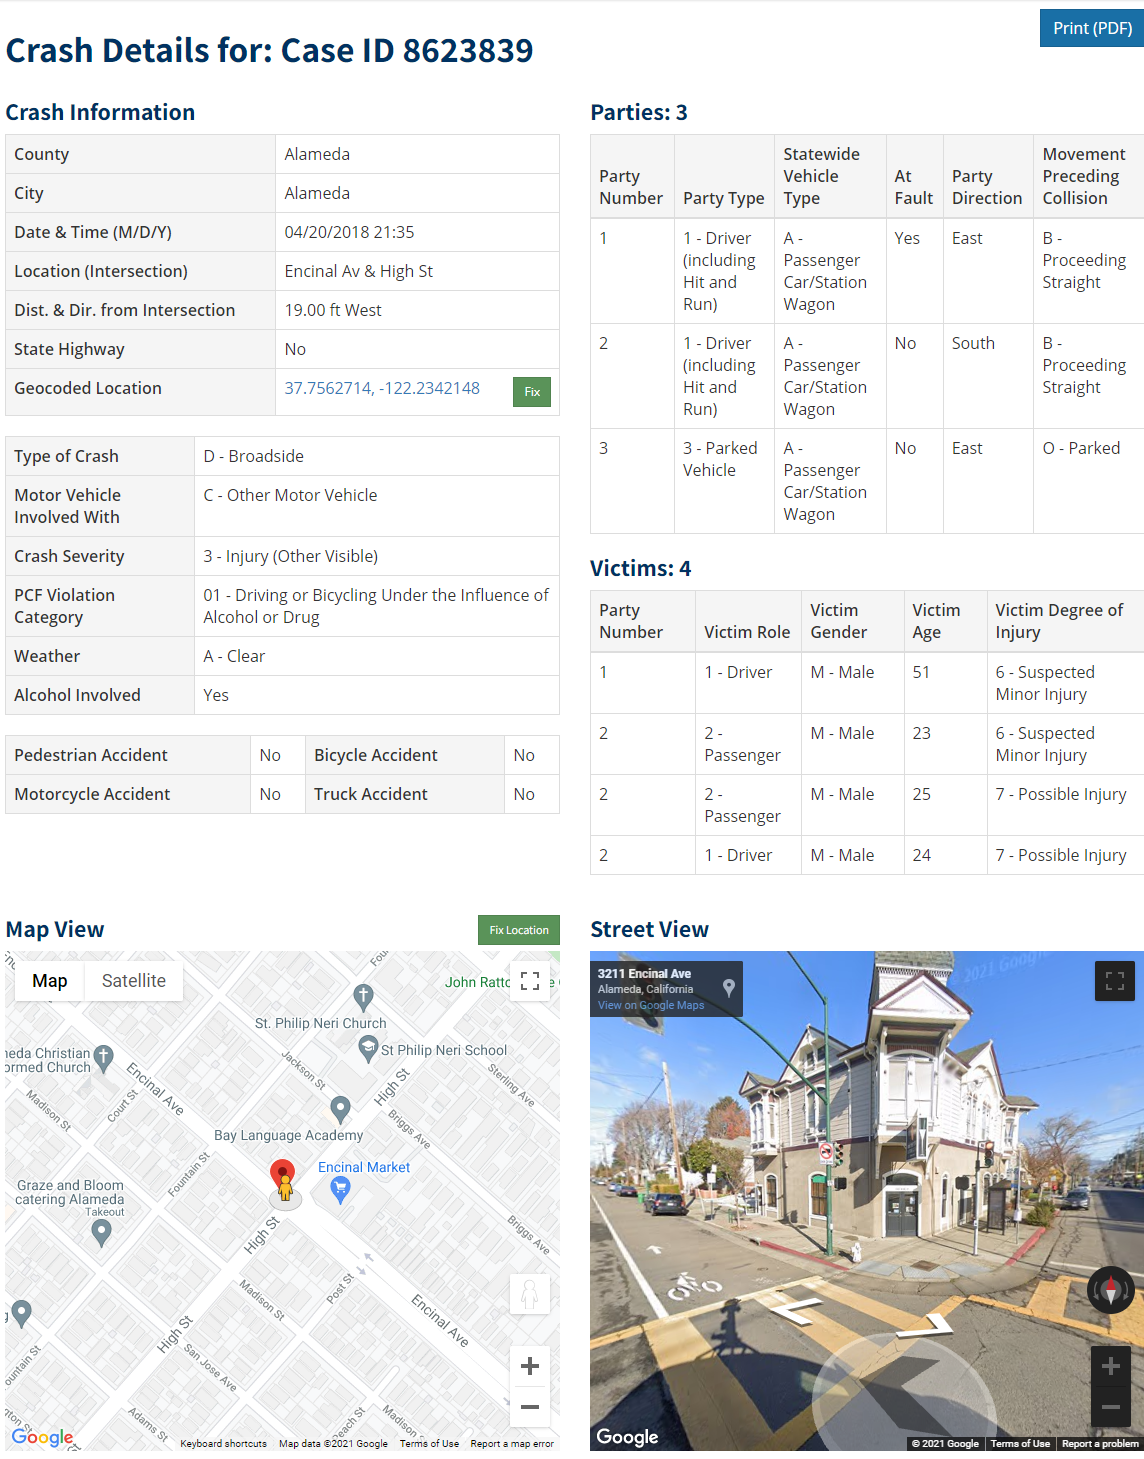
Crash Details Page
To learn more about a crash, click on its marker and then click Crash Details in the pop up. This opens a Crash Details page for that crash, where you can interact with the Google Maps street view to look at the intersection or area where the crash occurred. From this profile page, you can also see that this crash is a pedestrian crash, that the right of way was the primary crash filter, and other basic useful information.
Frequently Asked Questions
Mapping SWITRS
How can I make my map queries load faster?
The SWITRS crash, party and victim files contain numerous fields for each crash. When querying statewide over multiple years, it takes a considerable amount of work for the server to find all matching crashes. If you subsequently map those results, the performance will also be slower to accommodate so many records. It is recommended to restrict your query based on time, location, or crash filters as much as possible, especially for exploration purposes. There are approximately 200,000 fatal or injury records each year in SWITRS, so queries can become large very easily.
Why do I see a different number of crash results for the same query in SWITRS Query & Map vs. SWITRS GIS Map?
The SWITRS Query & Map includes all crashes regardless of whether they were geocoded or not. The SWITRS GIS Map only uses the data that was geocoded and could be mapped. Therefore, you will usually see a lower number of crashes in the SWITRS GIS Map than the SWITRS Query & Map tools. You can verify which crashes were not mapped in the SWITRS Query & Map tool by clicking on the 'List Unmapped Crashes' button above map on the summary page. You may also need to perform a 'Refresh Crashes' in the SWITRS GIS Map to show all the crashes in the current extent. A warning message in the application will state that only 5,000 crashes can be shown at once.
Why do I see fewer crashes in my query than in my SWITRS data in our office?
TIMS contains the fatal and injury crashes, but property damage only (PDO) crashes are not included. Many agencies have the property damage only crashes in their local datasets, so there will be a greater number of crashes. Not all records were able to be geocoded, either, so you may see fewer crashes in the Results Map.
Data
How do I find out what SWITRS fields and their values mean?
The format of SWITRS data and descriptions of each of the data fields and their range of values are described in the SWITRS Codebook page.
Can you give more information about the geocoded coordinates in the SWITRS data files?
Approximately 95 percent of fatal and severe injury crashes have been geocoded through a process developed at SafeTREC. The POINT_X and POINT_Y fields contain the longitude/latitude geocoded coordinate locations based on the 1984 World Geodetic System (WGS84). If the crash was unable to be geocoded, these two fields will remain blank. If you are downloading a subset of data, it will include all crashes that matched your criteria, but if you use the mapping tools only crashes that were geocoded will be displayed. Note that these geocoded coordinate locations are different from the GPS coordinates that are also provided by SWITRS which are available by LATITUDE and LONGITUDE fields.
How do I display downloaded SWITRS datasets in other GIS software or applications?
There are countless software and web applications for displaying data with XY coordinates. Each application will have its own steps, but it should be relatively straightforward. Here is the help for displaying data in ArcGIS.
Why are there fewer crashes in the most recent year of data available?
It currently takes about 12-18 months for the California Highway Patrol (CHP) to input SWITRS crash data. For example, the final dataset for 2018 will likely not be available until summer 2020. On TIMS, we extract the most recent year of data available from the CHP on a quarterly basis. It will contain whatever records have already been input by CHP before that date. Therefore, until the most recent year is finalized, it will always show fewer crashes in TIMS.