About
These tools are focused on providing an overview of traffic safety crashes in California. If you are looking to get the number of annual pedestrian deaths or DUI crashes for example, these tools are right for you.
Data Sources & Updates
All 4 of these tools use the Statewide Integrated Traffic Records System (SWITRS) as the primary data source.
The Traffic Safety Overview Dashboard uses additional demographic data from the American Community Survey. For more information, please see our Help section.
Available Tools

SWITRS Summary
Navigate trends of fatal and injury crashes, fatalities and injuries to pedestrians, bicyclists, motorcyclists, older adults and unrestrained vehicle passengers, fatalities and injuries related to alcohol, drugs, distracted driving, and speeding in California.

Traffic Safety Overview Dashboard
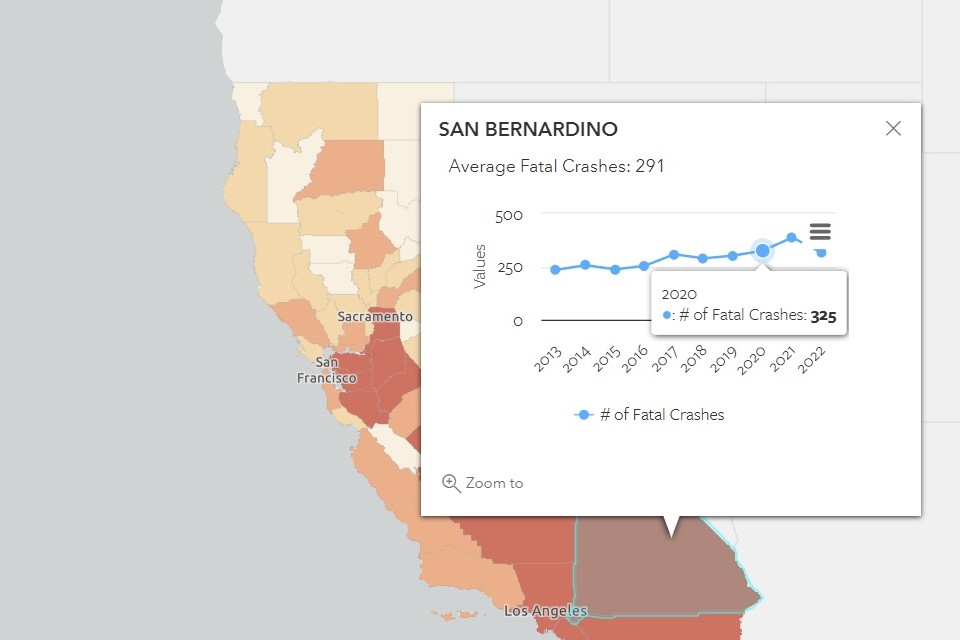
Identify at risk communities based on traffic safety and demographic data in California.

DUI Crash Summary and Map
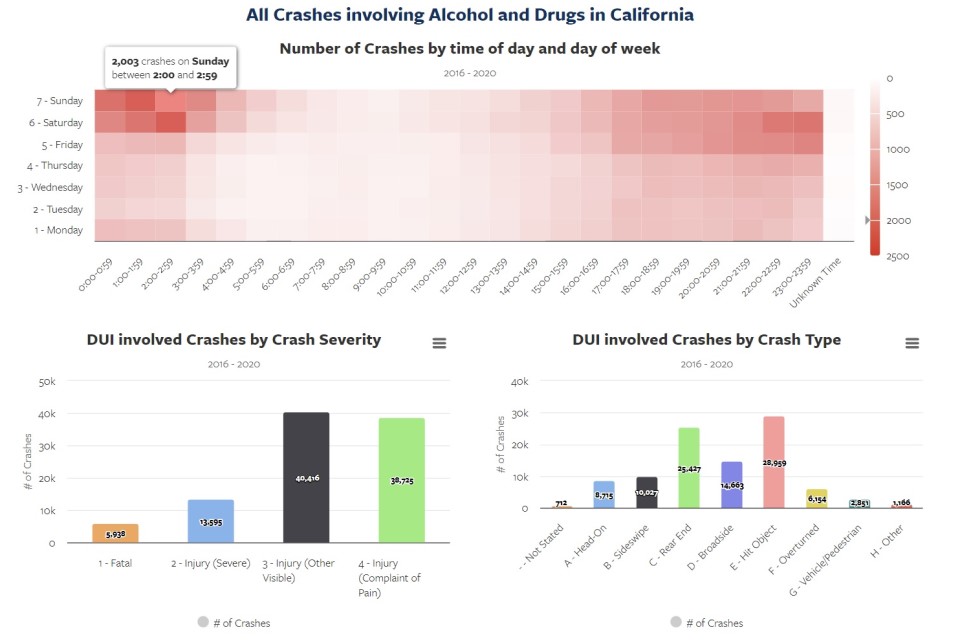
Explore alcohol- and drug-related crash and injury trends, both statewide and in a county or city area.

Weekly Crash Trends
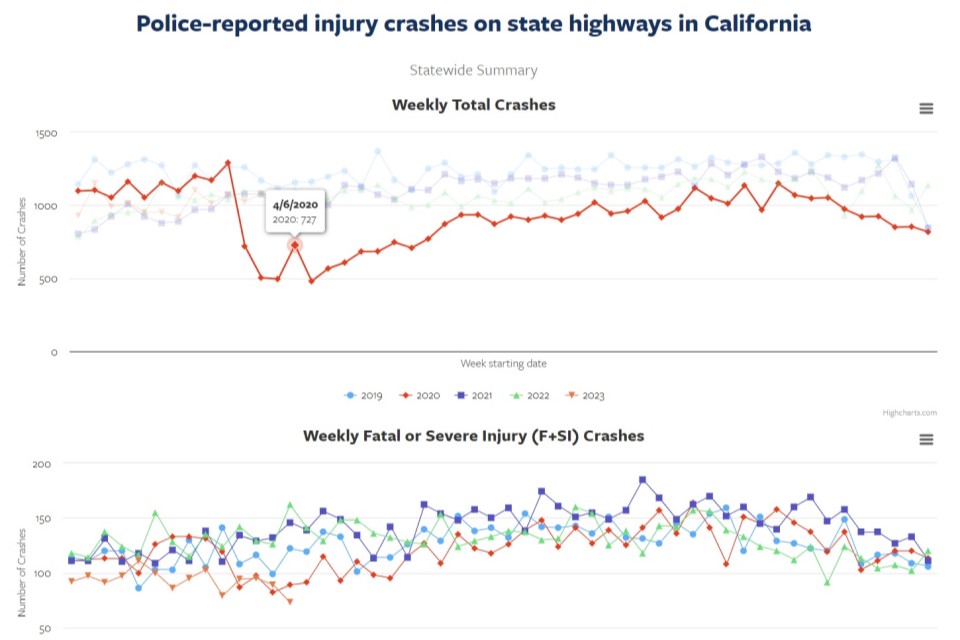
Visualize weekly fatal and injury crashes on state highways in California. The tool can be used to monitor the frequency and type of crashes that occur on a weekly basis for recent years.
